Disability is a natural part of the human experience and affects people of all races. We recently analyzed some data that gave us greater insight into Black workers with disabilities. Here are a few of the facts we uncovered:
Nearly 2.5 million working age Black adults in the United States have a disability:
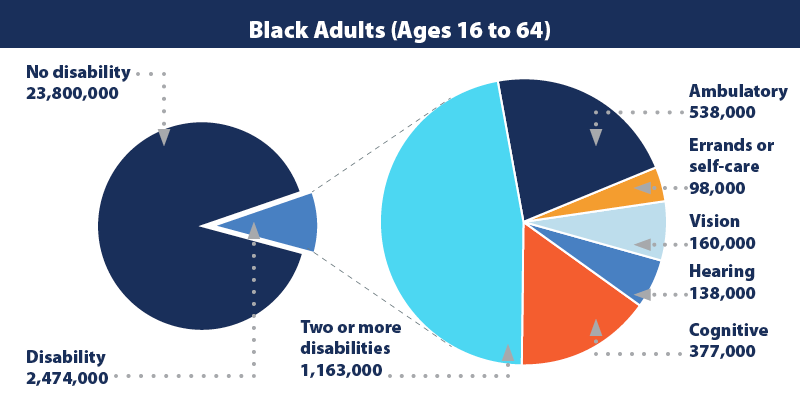
Chart data: Types of disabilities among Black adults, ages 16 to 24. No disability: 23,800,000. Disability: 2,474,000. Two or more disabilities: 1,163,000. Ambulatory: 538,000. Errands or self-care: 98,000. Vision: 160,000. Hearing: 138,000. Cognitive: 377,000. Source: Bureau of Labor Statistics Current Population Survey 2021.
874,000 Black adults with disabilities are currently working or want to work:
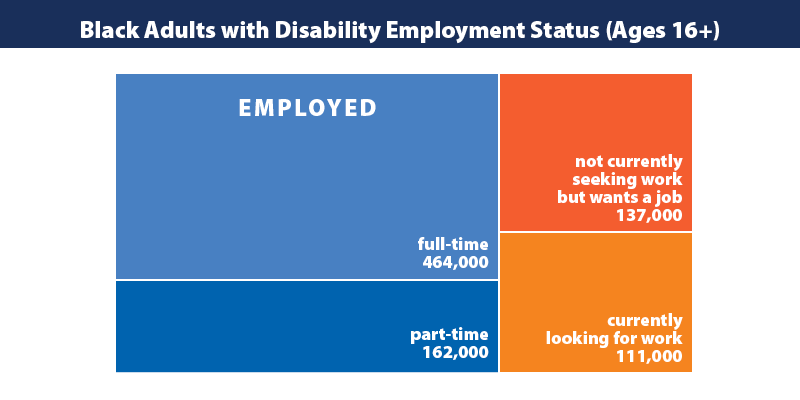
Chart data: Black adults with disability employment status, ages 16 and up. Employed full-time: 464,000. Employed part-time: 162,000. Currently looking for work: 111,000. Not currently seeking work but wants a job: 137,000. Source: Bureau of Labor Statistics Current Population Survey 2021.
Black adults with disabilities work in a range of industries, with the largest numbers in either educational and healthcare services or professional and business services:

Chart data: Industries of employment for Black adults, ages 16 and up. Educational and health services: 166,000. Professional and business services: 91,000. Wholesale and retail trade: 74,000. Manufacturing: 47,000. Financial activities: 39,000. Occupations for Black adults, ages 16 and up. Medical: 70,000. Retail: 40,000. Production: 32,000. Managers: 27,000. Teachers: 25,000. Source: Bureau of Labor Statistics Current Population Survey 2021.
The Office of Disability Employment Policy promotes policies and coordinates with employers and all levels of government to increase workplace success for people with disabilities. ODEP's mission is to develop and influence policies and practices that increase the number and quality of employment opportunities for people with disabilities.
Read our full analysis to learn more about Black workers with disabilities.
David Rosenblum, Amy Fong, Jackson Costa and Savi Swick all work in the Office of Disability Employment Policy.