When thinking about a new career, what information do you look for? You probably want to know if jobs in that field are growing and whether the demand for those jobs is increasing or decreasing in the future.
This information is available in the employment projections data, which is published every year by Bureau of Labor Statistics covering a 10-year period. The latest employment projections data for 2023 to 2033 were released on Aug. 29, showing that the economy is projected to add 6.7 million new jobs, with total employment growing 4.0%. Here are some of the highlights:
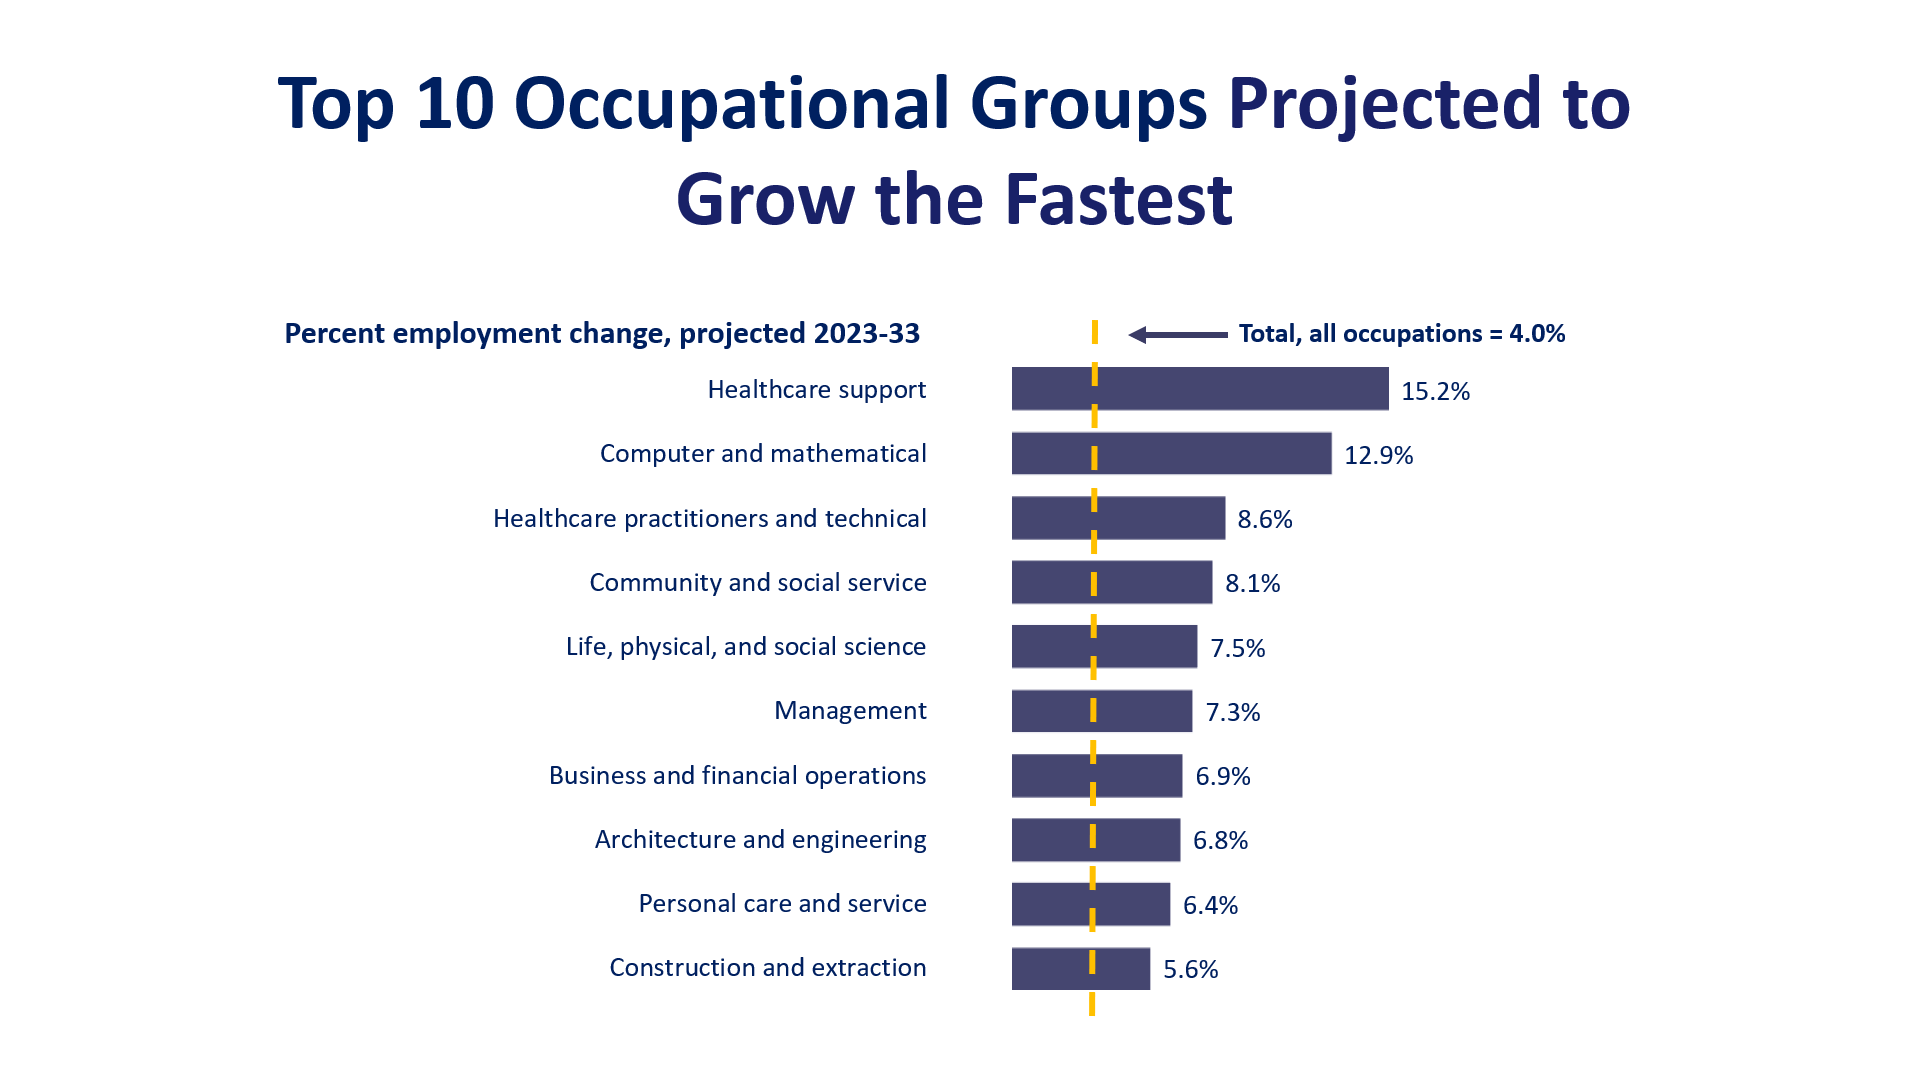
1. Fastest growing occupational groups
The healthcare support occupational group is expected to see the fastest employment growth and to add the most jobs over the projections decade. Combined with the healthcare practitioners and technical occupations group, these two healthcare groups account for over 1 in 4 projected new jobs to be added from 2023-33. Among the occupations included in the groups, the largest is home health and personal care aides. It's projected to grow 20.7% and add 820,500 jobs by 2033, partly due to a growing elderly population and higher instances of chronic conditions.
Strong demand for information technology (IT) products and services, including automation and machine learning technologies, are fueling the fast growth of computer and math occupations.
Community and social service occupations, the fourth-fastest growing occupational group, includes workers such as counselors, social workers, and religious workers.
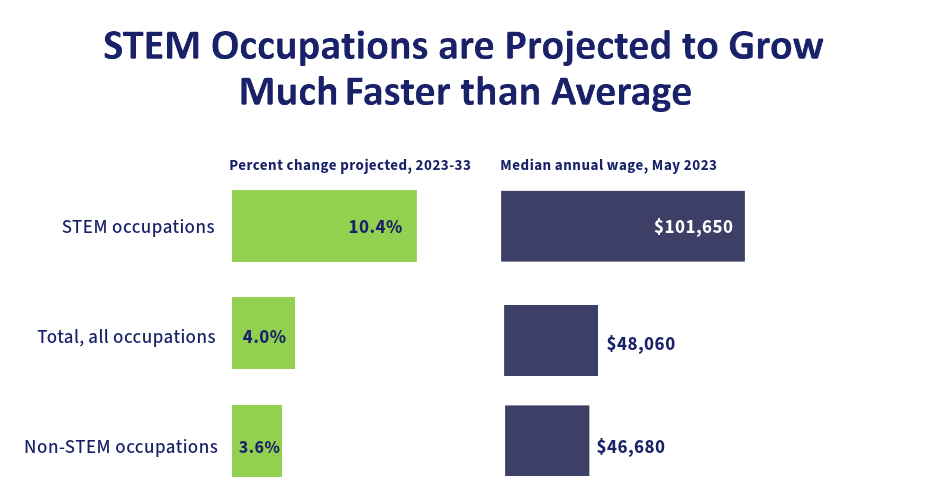
2. Growth of STEM occupations
Strong demand for many products and services will drive fast growth in science, technology, engineering and math (STEM) occupations. In fact, as a group, STEM occupations are projected to grow 10.4% by 2033 – faster than the average for all occupations (4.0%).
Demand for services and products related to IT, cybersecurity, and research and development in automation and machine learning technologies (like artificial intelligence and robotics) will contribute to the fast growth that is expected for computer and math occupations. Additional demand from businesses for data analysis is expected to drive growth for math occupations.
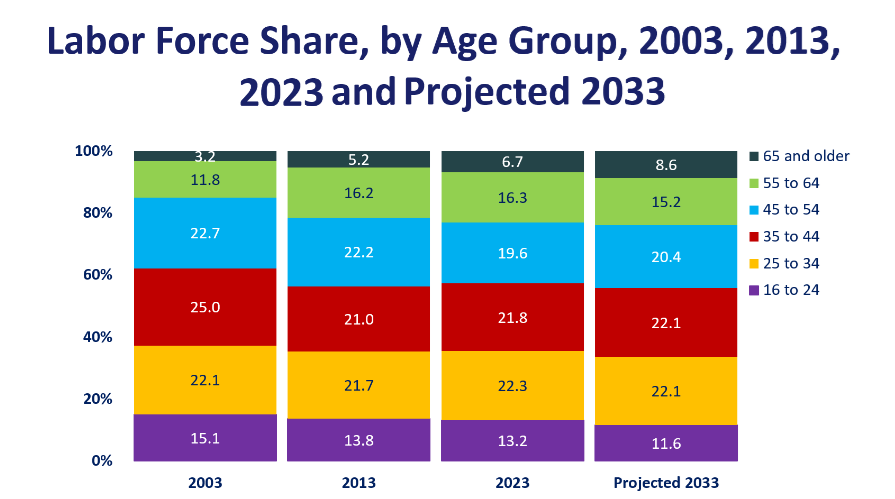
3. Changes in labor force share by age group
While the majority of the labor force will remain workers ages 25-54, the youngest group, those ages 16-24, is projected to see a decline in their share of the labor force by 2033, in part the result of lower birth rates in recent years.
In contrast, people ages 65 and older are projected to experience the fastest increase in their share of the labor force, although they will still account for the smallest share of the labor force among all age groups in 2033.
Want to dive deeper into the latest employment projections? Check out these charts and explore 800+ occupations in the Occupational Outlook Handbook.
Stanislava Ilic-Godfrey and An Nguyen are economists in the Bureau of Labor Statistics. Follow BLS on X/Twitter at @BLS_gov.