As a college athlete playing soccer, I learned some important lessons from working towards a common goal with my teammates and navigating our wins and losses together. We were afforded those meaningful experiences on the field because of the impact of Title IX, which dramatically increased participation in – and available funding for – women's athletics in publicly funded schools.
June 23 marks the 50th anniversary of the day that Title IX of the Education Amendments was signed into law. What began as a series of hearings to explore the discrimination women faced at educational institutions grew into a movement for equal opportunity in classrooms, playing fields and boardrooms. Until that day not so long ago, it was perfectly legal for federally funded schools and education programs and activities to discriminate against women and girls on the basis of sex. Title IX made this illegal, and in doing so, opened up a new world of opportunity for the generations of women since – including me.
Many of us see Title IX’s impact in women’s sports as a significant accomplishment, and it is. But there are still areas for improvement and progress – namely, ensuring real equal funding for women’s sports and protecting the rights of transgender women and girl athletes. Title IX’s reach has gone much further than sports, impacting gender inclusivity in education and society at large.
When Title IX passed, women were still the minority at college graduations. In 1972 only 44% of bachelor’s, 40% of master’s, and 11% of doctorate degrees were awarded to women. Just 10 years later in 1982, women reached parity with men in obtaining undergraduate degrees. By the 2019-2020 school year, women far outpaced men at every level of educational attainment. Women earned 58% of bachelor’s, 61% of master’s, and 55% of doctorate degrees awarded that year.
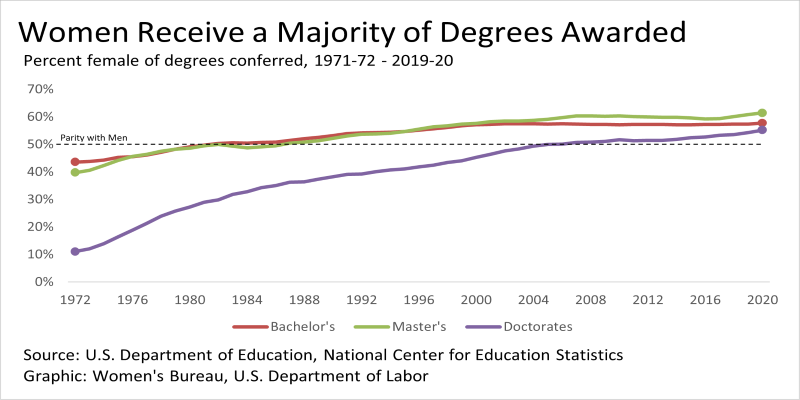
Women Receive a Majority of Degrees Awarded - plain text chart
Despite this momentous leap forward in education, Title IX has not been able to completely undo a longstanding legacy of gendered norms and stereotypes. A generation ago, many of our moms, mine included, became school teachers because this was one of few career paths open to them. Unfortunately, the jobs and careers with higher concentrations of women have tended to be the jobs that pay less.
This is a big part of why women continue to consistently make less than men, in spite of having higher levels of formal education. On average, women who work full-time all year round still only get paid 83% of what men make. Among Black women this figure is 64%, and among Hispanic women it is 57%. And getting an education isn’t enough to undo this disadvantage, because women make less than men at every level of educational attainment. In fact, the average woman with an advanced degree makes less than a man with just a bachelor’s. Much of the difference in pay can be explained by the disproportionate concentration of women in low paying jobs, the devaluation of work done by women, unconscious bias and outright discrimination.
Title IX has had a tremendous impact on gender equality, but there is still much more work to be done. One stark example of both is the representation of women in STEM fields. Since 1970, the representation of women has increased across all STEM occupations, going from 8% of STEM workers in 1970 to 27% in 2019. Women have made significant gains in social science occupations in particular, from 19% in 1970 to 64% in 2019. Women in 2019 also made up nearly half of those in all math (47%) and life and physical science (45%) occupations. But men still dominate the STEM field, making up 52% of all U.S. workers but 73% of all STEM workers. This is largely due to the high concentration of men in computer and engineering occupations, which account for 8 out of every 10 STEM jobs. Women still only represent about a quarter of computer workers and 15% of those in engineering occupations.
This is in large part because of all the degrees awarded in STEM fields in the 2019-2020 school year, only 34% were awarded to women. Of this, a majority of the degrees (55%) were awarded to white women, compared to 15% apiece for Hispanic and Asian/Pacific Islander women, 10% for Black women, 5% for women or two or more races and 0.4% for American Indian/Alaska Native women - showing that we still have work to do to ensure opportunities for women and girls of all backgrounds.
Title IX opened so many new opportunities for women, including me. But one piece of legislation cannot undo centuries of sexism, which means that our work still remains. We need to continue to encourage more young girls, especially young girls of color, to explore their talents and interests in non-traditional fields of study and work. We also need to recognize that equal opportunities in education will only take us so far towards better labor market outcomes for women; passing policies related to childcare and paid leave are also vital. We have come a long way from believing women were too delicate to run long distances or were not intelligent enough to grasp mathematics, but we must continue to work to ensure ALL women have equal opportunity in sports, education and society.
Register to attend our Title IX 50th Anniversary webinar on June 30, 12-1 p.m. ET.
Wendy Chun-Hoon is the director of the U.S. Department of Labor’s Women’s Bureau. Follow the Women’s Bureau on Twitter at @WB_DOL.
Women Receive a Majority of Degrees Awarded - plain text chart
| % Female Degrees Conferred | |||
| Graduation Year | Bachelor's | Master's | Doctorates |
| 1972 | 44% | 40% | 11% |
| 1973 | 44% | 41% | 12% |
| 1974 | 44% | 42% | 14% |
| 1975 | 45% | 44% | 16% |
| 1976 | 45% | 46% | 19% |
| 1977 | 46% | 46% | 21% |
| 1978 | 47% | 48% | 24% |
| 1979 | 48% | 48% | 26% |
| 1980 | 49% | 49% | 27% |
| 1981 | 50% | 49% | 29% |
| 1982 | 50% | 50% | 30% |
| 1983 | 51% | 49% | 32% |
| 1984 | 50% | 49% | 33% |
| 1985 | 51% | 49% | 34% |
| 1986 | 51% | 50% | 35% |
| 1987 | 51% | 50% | 36% |
| 1988 | 52% | 51% | 36% |
| 1989 | 53% | 51% | 37% |
| 1990 | 53% | 52% | 38% |
| 1991 | 54% | 53% | 39% |
| 1992 | 54% | 54% | 39% |
| 1993 | 54% | 54% | 40% |
| 1994 | 54% | 54% | 41% |
| 1995 | 55% | 55% | 41% |
| 1996 | 55% | 55% | 42% |
| 1997 | 56% | 56% | 42% |
| 1998 | 56% | 57% | 43% |
| 1999 | 57% | 57% | 44% |
| 2000 | 57% | 58% | 45% |
| 2001 | 57% | 58% | 46% |
| 2002 | 57% | 58% | 48% |
| 2003 | 57% | 59% | 48% |
| 2004 | 57% | 59% | 49% |
| 2005 | 57% | 59% | 50% |
| 2006 | 58% | 60% | 50% |
| 2007 | 57% | 60% | 51% |
| 2008 | 57% | 60% | 51% |
| 2009 | 57% | 60% | 51% |
| 2010 | 57% | 60% | 52% |
| 2011 | 57% | 60% | 51% |
| 2012 | 57% | 60% | 51% |
| 2013 | 57% | 60% | 51% |
| 2014 | 57% | 60% | 52% |
| 2015 | 57% | 60% | 52% |
| 2016 | 57% | 59% | 53% |
| 2017 | 57% | 59% | 53% |
| 2018 | 57% | 60% | 54% |
| 2019 | 57% | 61% | 54% |
| 2020 | 58% | 61% | 55% |
* Editor's note: This blog was updated to correct a misspelling in the first chart.