November is National Veterans and Military Families Month, when we honor and recognize the service of U.S. veterans. Here are six stats about veterans in the labor force you may not know.
1. Four major occupational groups have higher concentrations of veterans than nonveterans.
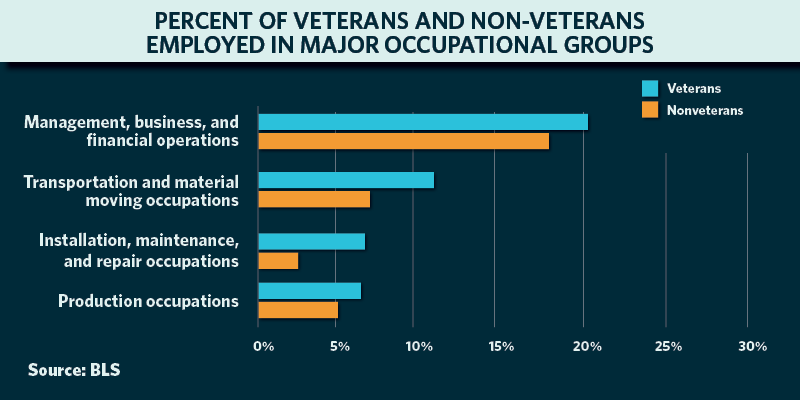
Percent of veterans and nonveterans employed in selected occupational groups (plain text)
Following the Current Population Survey (CPS) occupational classification, out of the 10 major occupation groups, four have statistically higher concentrations of veterans than nonveterans (see Employment Situation of Veterans – 2020, Table 4).
For example, 11% of all veterans work in the transportation and material moving occupations group compared with 7% of nonveterans.
2. Two occupational groups have a higher concentration of women veterans than men.
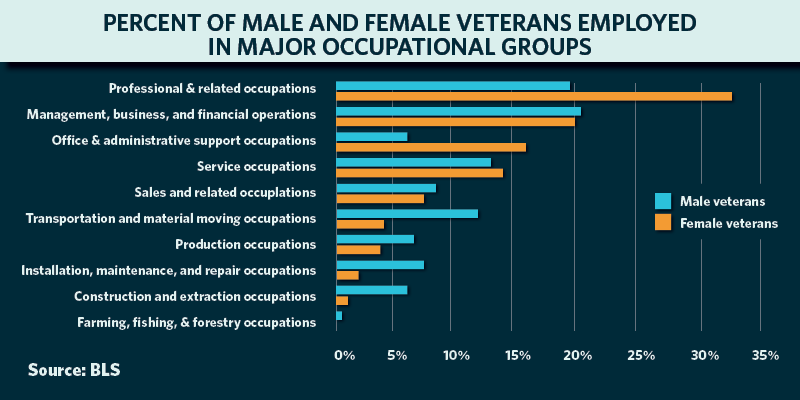
Percent of male and female veterans employed in major occupational groups (plain text)
Women veterans have a statistically higher concentration than men veterans in professional and related occupations as well as office and administrative support occupations (see Employment Situation of Veterans – 2020, Table 4).
3. The veteran unemployment rate is nearing its pre-pandemic level.
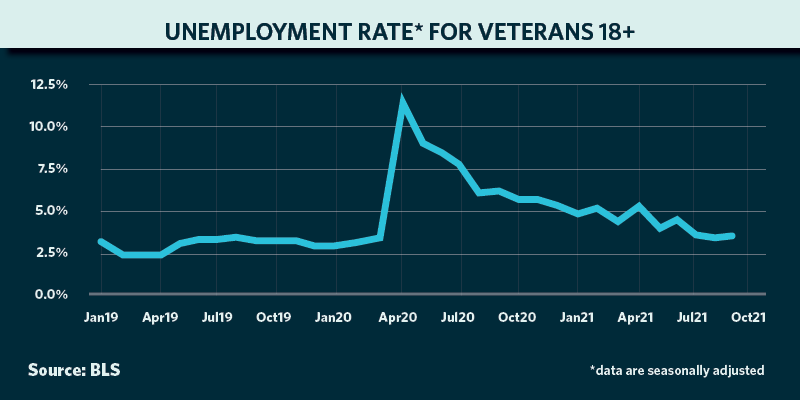
Unemployment rate for veterans 18+ (plain text)
The veteran unemployment rate (18 years and older, seasonally adjusted) peaked at 11.9% in April 2020. The seasonally adjusted September 2021 unemployment rate for veterans 18 years and over is 3.9%, which is 0.6 percentage points above the pre-pandemic low of 3.3% experienced in February 2020.
4. Among the major race and ethnicity groups, unemployment rates for veterans were lower than nonveterans.
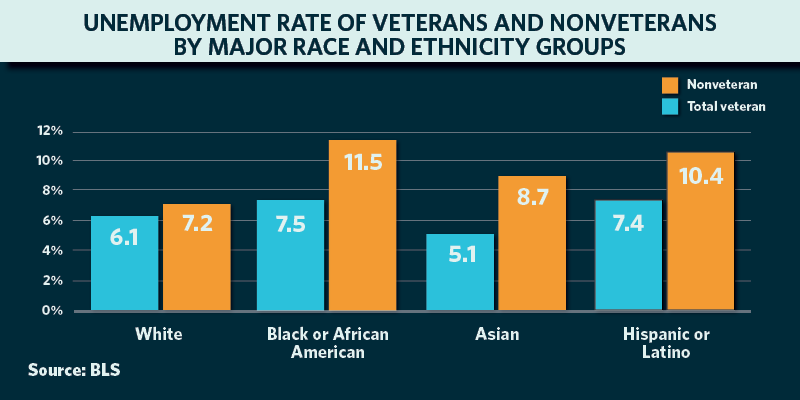
Unemployment rate of veterans and nonveterans by major race and ethnicity groups (plain text)
In 2020, the overall unemployment rate for veterans (6.5%) was lower than their nonveteran counterparts (8.0%). This holds true for all major race and ethnicity groups of veterans: Unemployment rates for white, Black, Asian, and Hispanic or Latino veterans were lower than their nonveteran counterparts in 2020. Among both veterans and nonveterans, the unemployment rates for Blacks and Hispanics or Latinos was higher than for whites or Asians.
5. Veterans represent 5.6% of the total civilian labor force today.
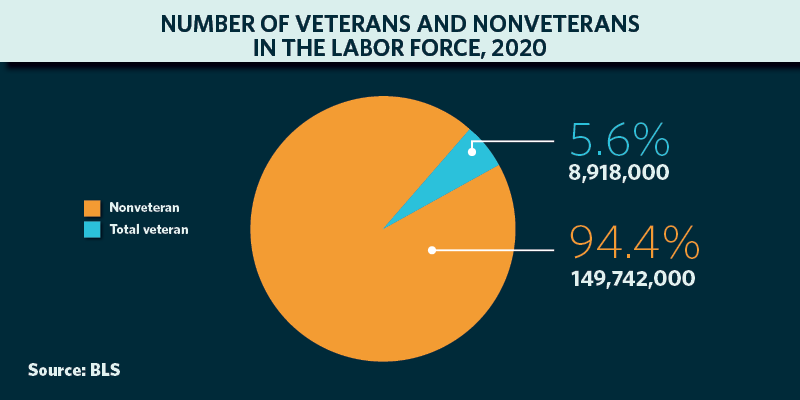
Number of veterans and nonveterans in the labor force, 2020 (plain text)
In 2020, there were 158,661,000 civilians in the total labor force, and of these, 8,918,000 were veterans.
6. There are fewer veterans in the labor force now than 20 years ago.
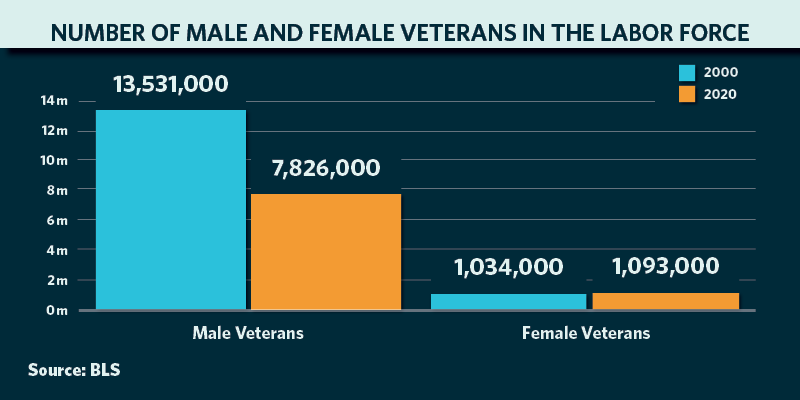
Number of male and female veterans in the labor force (plain text)
In 2000, there were more veterans in the labor force than in 2020 because there were more workers from the World War II, Korea and Vietnam eras. As these workers retired over the past 20 years, the number of veterans in the labor force dropped more than one-third.
Male veterans in the labor force decreased by 42% in this time period. At the same time, the number of women veterans in the labor force actually grew, as did the number of people in the labor force who have never served in the military.
Explore more data on veterans at https://www.bls.gov/cps/demographics.htm#vets.
Sara Hylton is an economist in the Bureau of Labor Statistics. Follow the bureau on Twitter at @BLS_gov.
Chart 1: Percent of veterans and nonveterans employed in selected occupational groups
[Unit: % percent]
| Occupation | Veterans | Nonveterans |
| Management, business, and financial operations occupations | 20.3 | 18.5 |
| Transportation and material moving occupations | 10.9 | 6.9 |
| Installation, maintenance, and repair occupations | 6.6 | 3.0 |
| Production occupations | 6.3 | 5.1 |
Chart 2: Percent of male and female veterans employed in major occupational groups.
[Unit: % percent]
| Occupation | Male veterans | Female veterans |
| Management, business, and financial operations occupations | 20.4 | 20.0 |
| Professional and related occupations | 19.8 | 32.6 |
| Service occupations | 12.9 | 14.3 |
| Sales and related occupations | 8.1 | 7.2 |
| Office and administrative support occupations | 6.0 | 16.7 |
| Farming, fishing, and forestry occupations | 0.5 | 0.0 |
| Construction and extraction occupations | 6.5 | 0.6 |
| Installation, maintenance, and repair occupations | 7.3 | 1.4 |
| Production occupations | 6.7 | 3.2 |
| Transportation and material moving occupations | 11.9 | 3.8 |
Chart 3: Seasonally Adjusted Unemployment Rate for Veterans 18+
[Unit: % percent]
| Year | Jan | Feb | Mar | Apr | May | Jun | Jul | Aug | Sep | Oct | Nov | Dec |
2011 | 8.9 | 8.7 | 8.3 | 7.8 | 8.5 | 9.1 | 8.7 | 8.0 | 8.5 | 8.1 | 7.5 | 7.6 |
2012 | 6.7 | 6.7 | 7.0 | 7.2 | 8.1 | 7.6 | 6.9 | 6.8 | 7.0 | 6.7 | 6.7 | 6.9 |
2013 | 6.9 | 6.7 | 6.7 | 6.4 | 6.9 | 6.5 | 6.4 | 6.3 | 6.8 | 7.3 | 6.7 | 5.4 |
2014 | 5.1 | 6.1 | 5.6 | 5.7 | 5.2 | 5.6 | 6.0 | 5.7 | 5.0 | 4.8 | 4.6 | 4.7 |
2015 | 4.8 | 5.2 | 4.7 | 4.9 | 5.2 | 4.4 | 4.6 | 4.2 | 4.5 | 4.2 | 3.7 | 4.8 |
2016 | 4.2 | 3.8 | 4.1 | 4.0 | 3.6 | 4.3 | 4.7 | 4.4 | 4.6 | 4.6 | 4.8 | 4.1 |
2017 | 4.0 | 3.7 | 3.6 | 3.8 | 3.6 | 3.8 | 3.5 | 3.8 | 3.2 | 3.1 | 4.0 | 3.9 |
2018 | 3.5 | 3.3 | 3.7 | 3.8 | 3.7 | 3.4 | 2.9 | 3.9 | 3.6 | 3.2 | 3.1 | 3.2 |
2019 | 3.1 | 2.5 | 2.5 | 2.5 | 3.0 | 3.3 | 3.3 | 3.6 | 3.3 | 3.4 | 3.4 | 2.9 |
2020 | 2.9 | 3.3 | 3.7 | 11.9 | 9.2 | 8.7 | 7.8 | 6.5 | 6.7 | 5.9 | 6.3 | 5.4 |
2021 | 4.9 | 5.2 | 4.6 | 5.3 | 4.4 | 4.8 | 3.9 | 3.8 | 3.9 |
Chart 4: Unemployment rate of veterans and nonveterans by major race and ethnicity groups
[Unit: % percent]
Race | Veteran | Nonveteran |
| White | 6.1 | 7.2 |
| Black or African American | 7.5 | 11.5 |
| Asian | 5.1 | 8.7 |
| Hispanic or Latino ethnicity | 7.4 | 10.4 |
Chart 5: Number of veterans and nonveterans in the labor force, 2020
[Unit: Number of veterans, and % percent]
| Labor force | Percentage of total labor force | |
| Veterans | 8,918,000 | 5.6 |
| Nonveterans | 149,742,000 | 94.4 |
Chart 6: Number of male and female veterans in the labor force
[Unit: Number of veterans]
Civilian Labor force | ||
Year | Women veterans | Men veterans |
2000 | 1,034,000 | 13,531,000 |
2020 | 1,093,000 | 7,826,000 |