
This month, the economy added 390,000 jobs, with a 3-month moving average of 408,000. Job growth remains steady. The unemployment rate remained unchanged, and the labor force participation rate ticked up to 62.3%. The economy saw job gains in transportation and warehousing (+47,000), leisure and hospitality (+84,000), education and health services (+74,000) and government (+57,000), as well as losses in retail trade (-61,000).
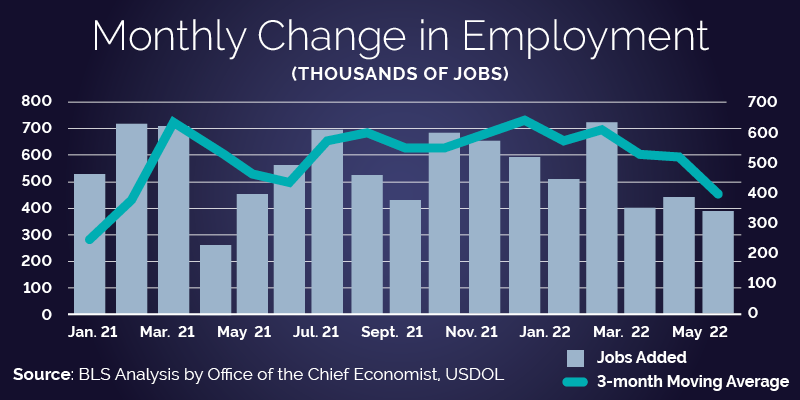
Monthly Change in Employment – plain text
Below the toplines, there is an important developing story in the labor market recovery: the speed of the job gains for specific groups of workers. In addition to the prime-age (25-54) employment-to-population ratio nearing its pre-pandemic figure, the employment-to-population ratio for Black men (65.0%) exceeds the pre-recession ratio by more than a percentage point. In other words, the number of employed Black men relative to total number of working age, noninstitutionalized Black men population is higher than it was after a years-long recovery. The ratio has been higher than the February 2020 figure for the last four months with a three-month moving average of 64.6% in May. This comes as the number of Black men in the civilian noninstitutional population and Black male employment levels continue to rise.
What is behind these numbers?
In May, Evgeniya Duzhak at the San Francisco Federal Reserve found that the unemployment rate for Black Americans did not fall as far as would be projected by past business cycles, due to the sectoral differences in job losses in 2020. Duzhak also found that Black men had the largest reduction in labor market sensitivity– which measures how their unemployment rate changes when economic activity (like a recession or boom) changes. Differences in labor market sensitivity, Duzhak concludes, imply that Black workers should have faced a slower recovery than workers with greater sensitivity.
The nature of the downturn meant that sectors with a disproportionate share of Black men, such as production and transportation jobs, suffered a lower degree of job loss. But the story of Black men’s employment today may not just be a story about starting points in the recovery, but the dynamics of the labor market recovery. Those same industries are now well above their pre-pandemic employment levels. It is possible that this is related to the tightness of today’s labor market, though there is nuance to that assertion.
High consumer demand for goods, supply chain challenges and an emphasis on production and logistics also meant that these sectors had a higher demand for workers than expected, leading to tighter markets and, potentially, more opportunities for Black men. The transportation and warehousing sector saw strong employment growth pre-pandemic and that trend has sped up in the recovery, with gains well above the February 2020 level.
These job gains are also consistent with what we’ve observed in global supply chains, including a large increase in shipping volumes in the U.S., a +7.7% increase in the Cass-Freight Index in 2021. (Note: The year-over-year percent change in the index is now slightly negative.) The transportation and warehousing sector saw large job gains in industries critical to meeting the consumer shift toward online retail and delivery, including warehousing and storage (+152,000) and couriers and messengers (+33,000). Meanwhile, truck transportation rose 3.7%, its largest employment percent increase since 2011. In many supply chain-related occupations, Black men are overrepresented. In 2021, about 28% of employed Black men in non-managerial or professional occupations worked in transportation and material moving occupations. This is compared to about 17% of white men and 18% of all men. Improvements along supply chains may be related to strong job gains for Black men.
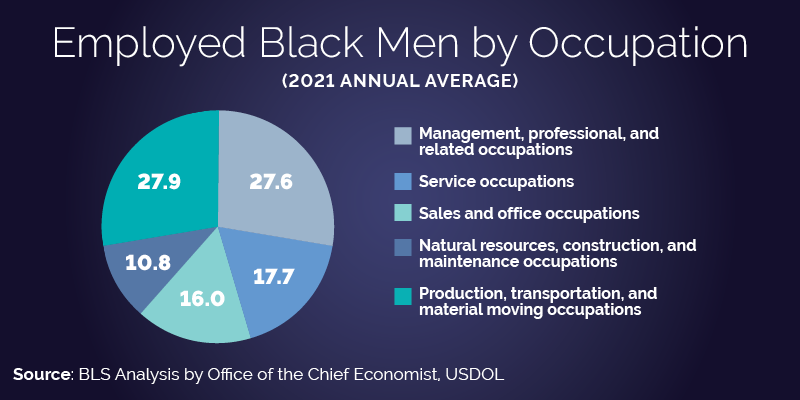
Employed Black Men by Occupation – plain text
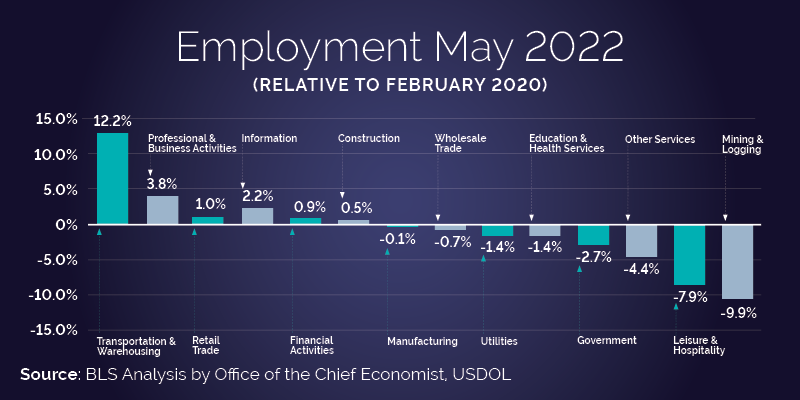
Employment Level Relative to February 2020 – plain text
Despite these positive signs, inequities persist. The three-month Black male unemployment rate in May (5.7%) was still higher than that of white men (3.1%) and the Black male employment-to-population ratio is 2.9 percentage points lower than that of white men. These gaps also do not account for the disproportionately high rates of incarceration for Black men, which excludes them from the employment-to-population ratio calculation altogether. There is more work to be done to improve employment outcomes for Black men and, importantly, to improve job quality and worker voice in sectors where they are overrepresented. Through our Good Jobs Initiative, we’re working to provide critical information to workers, employers and the government to help improve job quality and create access to good jobs free from discrimination and harassment for all working people.
Joelle Gamble is the chief economist for the U.S. Department of Labor.
Monthly Change in Employment – plain text:
|
Date |
Jobs Added |
3-Month Moving Average |
|
Feb. 2020 |
376 |
305 |
|
Mar. 2020 |
-1,498 |
-261 |
|
Apr. 2020 |
-20,493 |
-7,205 |
|
May 2020 |
2,642 |
-6,450 |
|
June 2020 |
4,505 |
-4,449 |
|
July 2020 |
1,388 |
2,845 |
|
Aug. 2020 |
1,665 |
2,519 |
|
Sep. 2020 |
919 |
1,324 |
|
Oct. 2020 |
647 |
1,077 |
|
Nov. 2020 |
333 |
633 |
|
Dec. 2020 |
-115 |
288 |
|
Jan. 2021 |
520 |
246 |
|
Feb. 2021 |
710 |
372 |
|
Mar. 2021 |
704 |
645 |
|
Apr. 2021 |
263 |
559 |
|
May 2021 |
447 |
471 |
|
June 2021 |
557 |
422 |
|
July 2021 |
689 |
564 |
|
Aug. 2021 |
517 |
588 |
|
Sept. 2021 |
424 |
543 |
|
Oct. 2021 |
677 |
539 |
|
Nov. 2021 |
647 |
583 |
|
Dec. 2021 |
588 |
637 |
|
Jan. 2022 |
504 |
580 |
|
Feb. 2022 |
714 |
602 |
|
Mar. 2022 |
398 |
539 |
|
Apr. 2022 |
436 |
516 |
|
May 2022 |
390 |
408 |
Employed Black Men by Occupation, 2021 annual average – plain text:
|
Management, professional, and related occupations |
27.6% |
|
Service occupations |
17.7% |
|
Sales and office occupations |
16.0% |
|
Natural resources, construction, and maintenance occupations |
10.8% |
|
Production, transportation, and material moving occupations |
27.9% |
Employment Level Relative to February 2020 – plain text:
|
Sector |
Feb. 2020 |
May 2022 |
Difference |
Percent Change |
|
Transportation and Warehousing |
5,795 |
6,504 |
709 |
12.2% |
|
Professional and Business Activities |
21,393 |
22,214 |
821 |
3.8% |
|
Retail Trade |
15,598 |
15,757 |
159 |
1.0% |
|
Information |
2,903 |
2,967 |
64 |
2.2% |
|
Financial Activities |
8,870 |
8,948 |
78 |
0.9% |
|
Construction |
7,624 |
7,664 |
40 |
0.5% |
|
Manufacturing |
12,785 |
12,768 |
-17 |
-0.1% |
|
Wholesale Trade |
5,893 |
5,852 |
-41 |
-0.7% |
|
Utilities |
547 |
539 |
-8 |
-1.4% |
|
Education and Health Services |
24,598 |
24,258 |
-340 |
-1.4% |
|
Government |
22,879 |
22,264 |
-615 |
-2.7% |
|
Other Services |
5,951 |
5,692 |
-259 |
-4.4% |
|
Leisure and Hospitality |
16,983 |
15,638 |
-1,345 |
-7.9% |
|
Mining and Logging |
686 |
618 |
-68 |
-9.9% |