
Small businesses are the engine of the American economy. They employ just under half of all U.S. workers and comprise more than 99% of businesses. Both small-business ownership and self-employment are important avenues to economic empowerment, particularly for people with disabilities. For many disabled workers, entrepreneurship allows greater access, freedom and flexibility at work. By owning their own business, people with disabilities may not only reduce or eliminate barriers in the workplace, but also maintain independence and economic stability within their communities.
Seeking Good Data
An inclusive and thriving economy needs business ownership among people with disabilities, employment of disabled people in small businesses, and policies to promote both. Good data form the starting point for policymakers to design sound policies, target initiatives and provide support services to encourage business ownership and entrepreneurship among disabled people. Therefore, collecting data about business owners with disabilities plays an important role in promoting inclusivity.
The Current Population Survey (CPS), sponsored jointly by the U.S. Census Bureau and the U.S. Bureau of Labor Statistics, is the primary source of labor-force statistics in the United States. It includes a set of six questions to identify people with disabilities, which in turn makes it possible to identify self-employed disabled business owners. However, additional measures of business ownership among people with disabilities are scarce.
To improve on the existing data, ODEP collaborated with the U.S. Census Bureau to include a disability question in a separate survey, the Annual Business Survey (ABS). The new question is based on the definition of disability under the Americans with Disabilities Act: “Does the owner have a physical or mental impairment that substantially limits one or more of his/her major life activities? For this survey, major life activities can include both those in everyday and professional life.”
The Latest Findings
In the figures below, we offer a first look at the newest data on business owners with disabilities, from the 2022 ABS. These survey data were collected in 2022, referencing the respondents’ 2021 experience, and were released in October 2023. We further compare these new data with information from the CPS on self-employed people and wage-and-salary employees.
The CPS data allow us to identify two types of self-employed people:
- self-employed “incorporated” workers, such as small-business owners, who have established a legal corporation and typically employ others; and
- self-employed “unincorporated” workers, such as freelancers, who have not established a corporation and often operate alone.
The ABS data, meanwhile, identify business owners. While not exact analogues (the CPS’s self-employed incorporated workers are the closest comparison group to the ABS’s business owners), a side-by-side look at both sets of data allows us to gain a broader understanding of business ownership and self-employment among disabled people.
How prevalent is disability among business owners? Are there differences by sex or veteran status ?

Three percent of business owners have disabilities, according to new data from the ABS. There is essentially no difference in disability prevalence between men and women business owners, but veteran business owners are much more likely to be disabled compared to nonveterans. According to the ABS, 8% of veteran business owners have disabilities. Source: Annual Business Survey 2022, which represents business ownership in 2021.
Are there differences in disability rates among business owners by race or ethnicity?
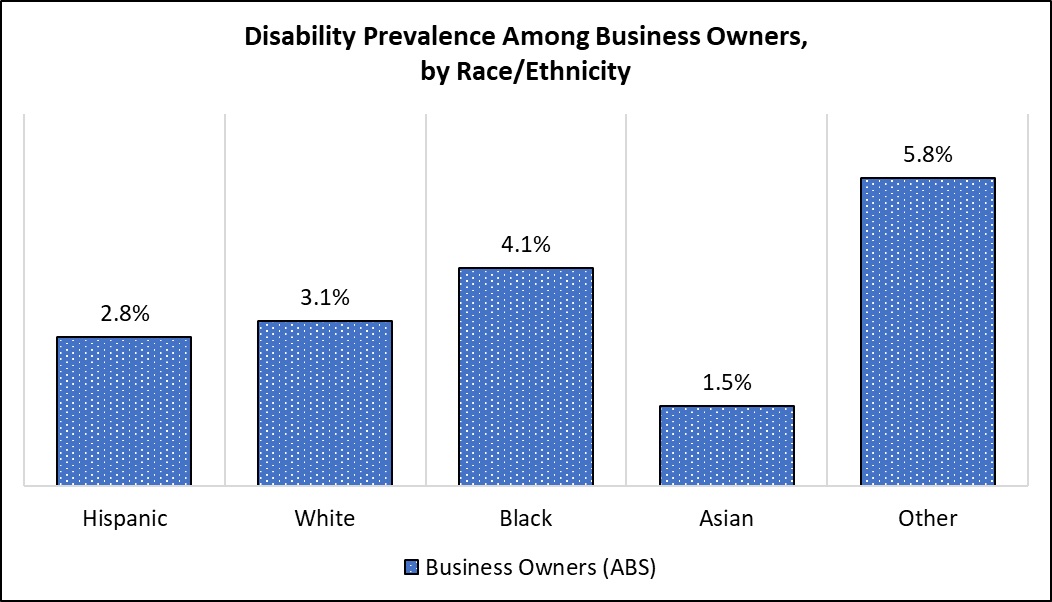
People identifying as Asian have the lowest disability rate among business owners, at 1.5%, compared to other groups. People identifying as “Other,” which includes Native Americans, Alaska Natives, Native Hawaiians and Pacific Islanders and people of mixed race, have the highest rates of disability among business owners. Black business owners have the next highest rate of disability among the groups, at 4.1%, with Hispanic and white business owners reporting rates of 2.8% and 3.1%, respectively.
How prevalent is disability among self-employed workers and wage-and-salary employees? Are there differences by sex or veteran status?
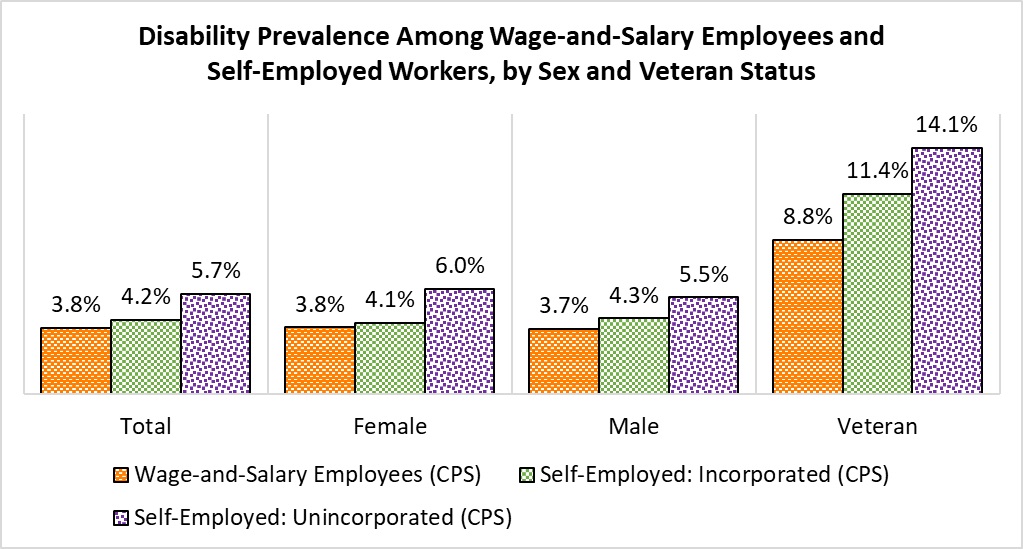
Compared to the business owners surveyed in the ABS, wage-and-salary employees and self-employed workers responding to the CPS report slightly higher rates of disability—but, overall, the estimates are not dissimilar. For instance, the graph just above shows that 3.8% of wage-and-salary employees, 4.2% of self-employed incorporated people and 5.7% of self-employed unincorporated people have disabilities. As was seen among business owners in the ABS, there are minimal differences in disability rates by sex among the CPS worker categories, yet we see much higher disability rates for veterans in each category. Among veteran workers, nearly 9% of wage-and-salary employees, 11.4% of self-employed incorporated workers and 14.1% of self-employed unincorporated workers have a disability. Across demographic groups, disability prevalence is lowest among wage-and-salary employees, higher among self-employed incorporated workers and highest among self-employed unincorporated workers. In other words, disabled people make up the largest proportion of the self-employed unincorporated group, which includes sole proprietors and freelancers, compared to the wage-and-salary employee and self-employed incorporated groups.
Worker Class Category | Total | Female | Male | Veteran |
Wage-and-Salary Employees | 3.8% | 3.8% | 3.7% | 8.8% |
Self-Employed: Incorporated | 4.2% | 4.1% | 4.3% | 11.4% |
Self-Employed: Unincorporated | 5.7% | 6.0% | 5.5% | 14.1% |
How does disability prevalence among business owners compare with prevalence among self-employed workers and wage-and-salary employees by race or ethnicity?

There are several interesting differences in disability prevalence by race among wage-and-salary employees and self-employed workers. For example, Asians report the lowest disability prevalence rates in every worker category compared with other racial groups, while those identifying as “Other” (including Native Americans, Alaska Natives, Native Hawaiians and Pacific Islanders and people of mixed race) report the highest rates of disability in each worker category.
Worker Class Category | Hispanic | White | Black | Asian | Other |
Wage-and-Salary Employees | 3.0% | 4.2% | 3.5% | 1.4% | 5.4% |
Self-Employed: Incorporated | 2.0% | 4.9% | 3.1% | 1.4% | 8.7% |
Self-Employed: Unincorporated | 3.2% | 6.6% | 5.2% | 2.7% | 8.6% |
Looking Ahead
Keep an eye on this blog for the second part of ODEP’s analysis of ABS and CPS data on business ownership among people with disabilities. Next, we will look at current rates of disability among business owners, by industry, and take a historical view of how disability rates have changed over time among self-employed workers.
In the meantime, we encourage small businesses that wish to promote the employment of disabled people to check out the ODEP-funded Employer Assistance and Resource Network on Disability (EARN) new Small Business Toolkit, which provides:
- Practical, affordable strategies to hire and retain disabled workers;
- Information to improve disability with limited resources;
- Advice on common topics for workers with disabilities; and
- Opportunities to learn about tax incentives and other supports for small businesses.
David Rosenblum is a Senior Economist for the Office of Disability Employment Policy.
Christopher McLaren is a Director of Research and Evaluation for the Office of Disability Employment Policy.