Amy Fong, a mathematical statistician in the department’s Office of Disability Employment Policy, recently interviewed Justin Tsang, Hanna Lee and Shruti Rajkumar of the Asian Americans with Disabilities Initiative to ask about the importance of ensuring research considers the unique experiences of this population in the United States. Below are highlights from their conversation. This is the latest in an ongoing series of data snapshots about different subgroups of people with disabilities; previous snapshots explored Black workers with disabilities and women with disabilities.
Q: Why do you think that Asian Americans have been underrepresented in research on disability, and what actions do you recommend to researchers who want to close this data gap?
A: There could be multiple reasons for this underrepresentation. First, we have noticed that few studies about people with disabilities focus on recruiting Asian Americans, which could lead to low research participation. In the future, researchers could partner with Asian American organizations when recruiting study participants to ensure a more diverse and representative sample.
Second, research often treats Asian Americans as a single group, which hides the diversity of our experiences. Researchers could disaggregate data by ethnic group whenever possible to learn more. They could create a central directory of all data sources that include both health care and labor outcomes, and Asian Americans by subgroups. If researchers begin to recognize disabled Asian Americans as a large and diverse group, they would be better able to shed light on our specific challenges and the unique ways that ableism impacts us.

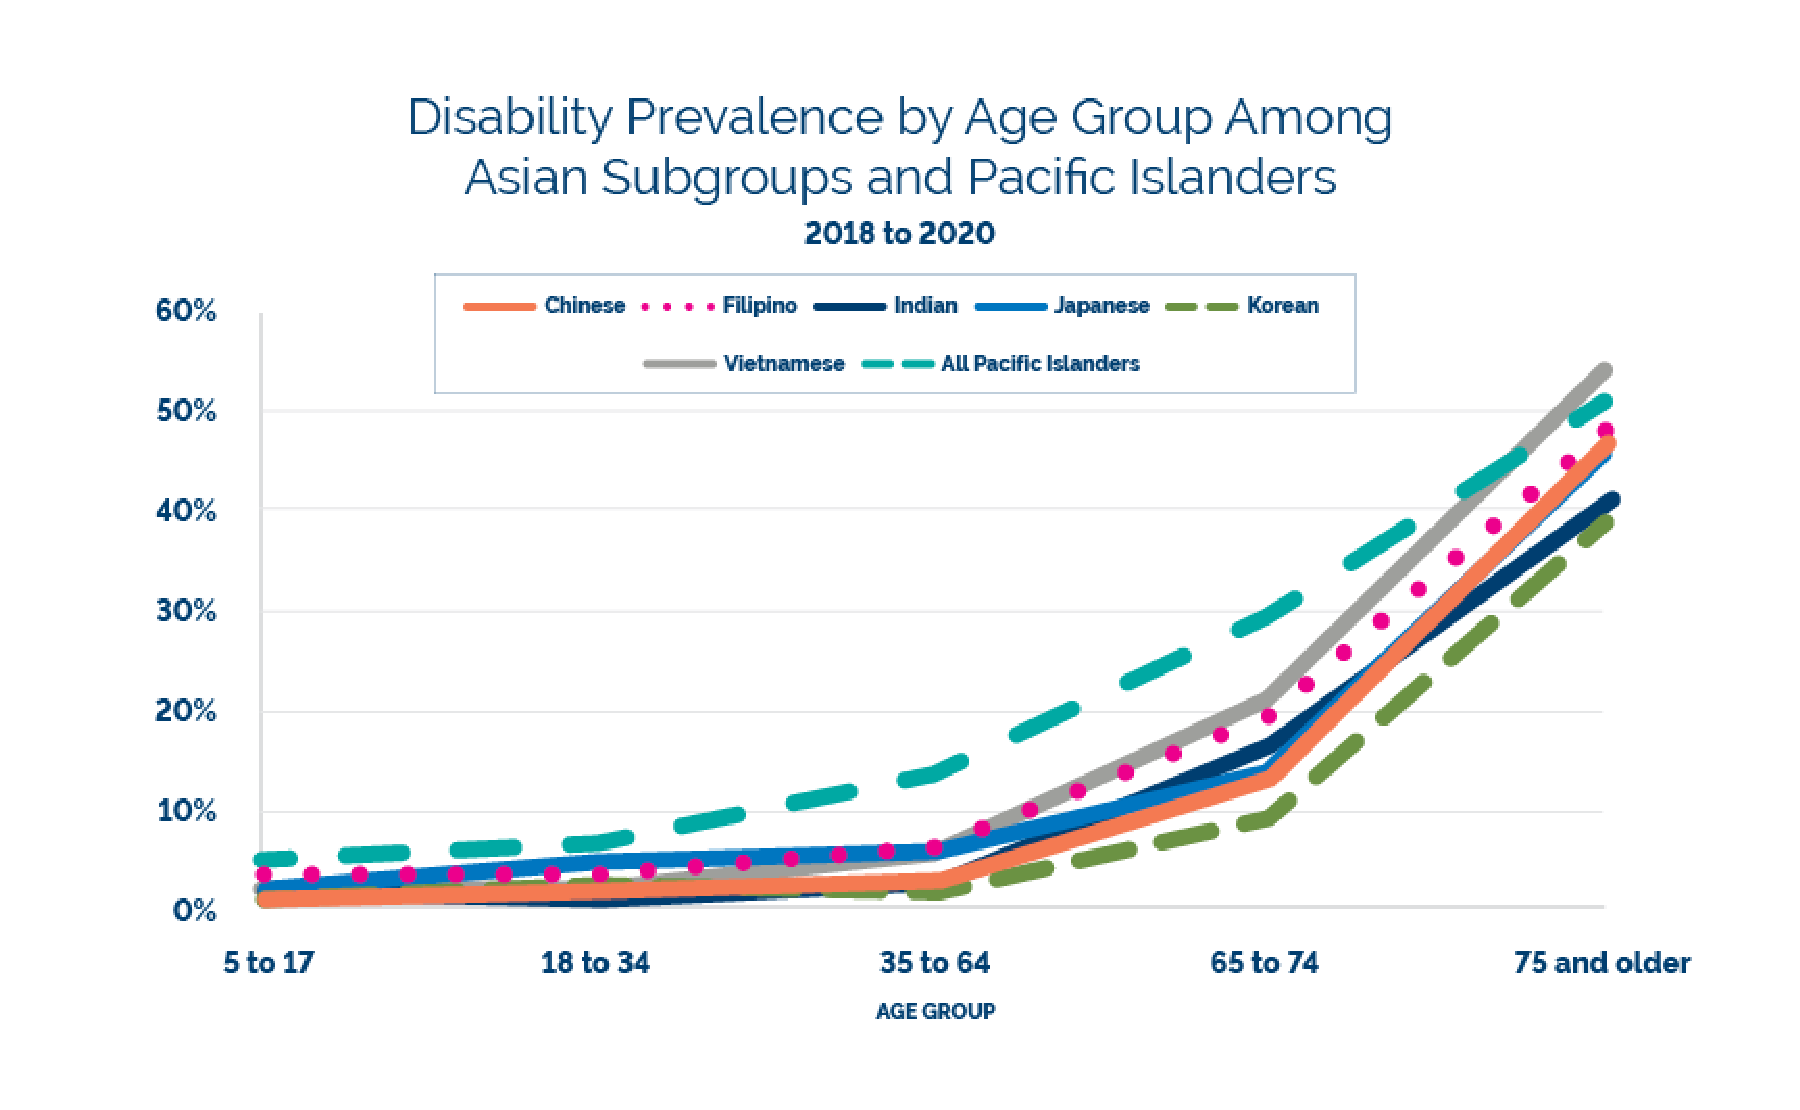
Disability Prevalence by Age Group Among Asian Subgroups and Pacific Islanders – plain text
Q: In the United States, the prevalence of disability among Asians is estimated to be lower compared with all other race and ethnicity groups, based on federal surveys that use six questions to identify disability. For many services and supports for people with disabilities, including employment programs, disability identification is the first step to access. What are some factors that you think may be influencing the lower rate of disability self-identification among Asian Americans?
A: We are exploring this as we are not sure. It could be that “model minority” stereotypes and Asian cultural norms contribute to the lower rate of disability self-identification. The model minority myth stereotypes some Asian Americans as always high achieving. But if educators, employers and service providers assume that we are less likely to have challenges, our disabilities might go unnoticed. Consequently, some Asian Americans might be less likely to pursue a diagnosis or identify as disabled.
In addition, the Asian American community is very large, and there can be varying cultural norms within it that can differ from Western ones. For example, some Asian cultures value conformity and collectivism over individualism. This could discourage emphasizing differences, like having a disability, to prevent feelings of shame and stigma. However, new organizations, such as AADI, celebrate the diversity of our community. We’re encouraged that many disabled Asian Americans are passionate about continuing to embrace the diversity within our community.

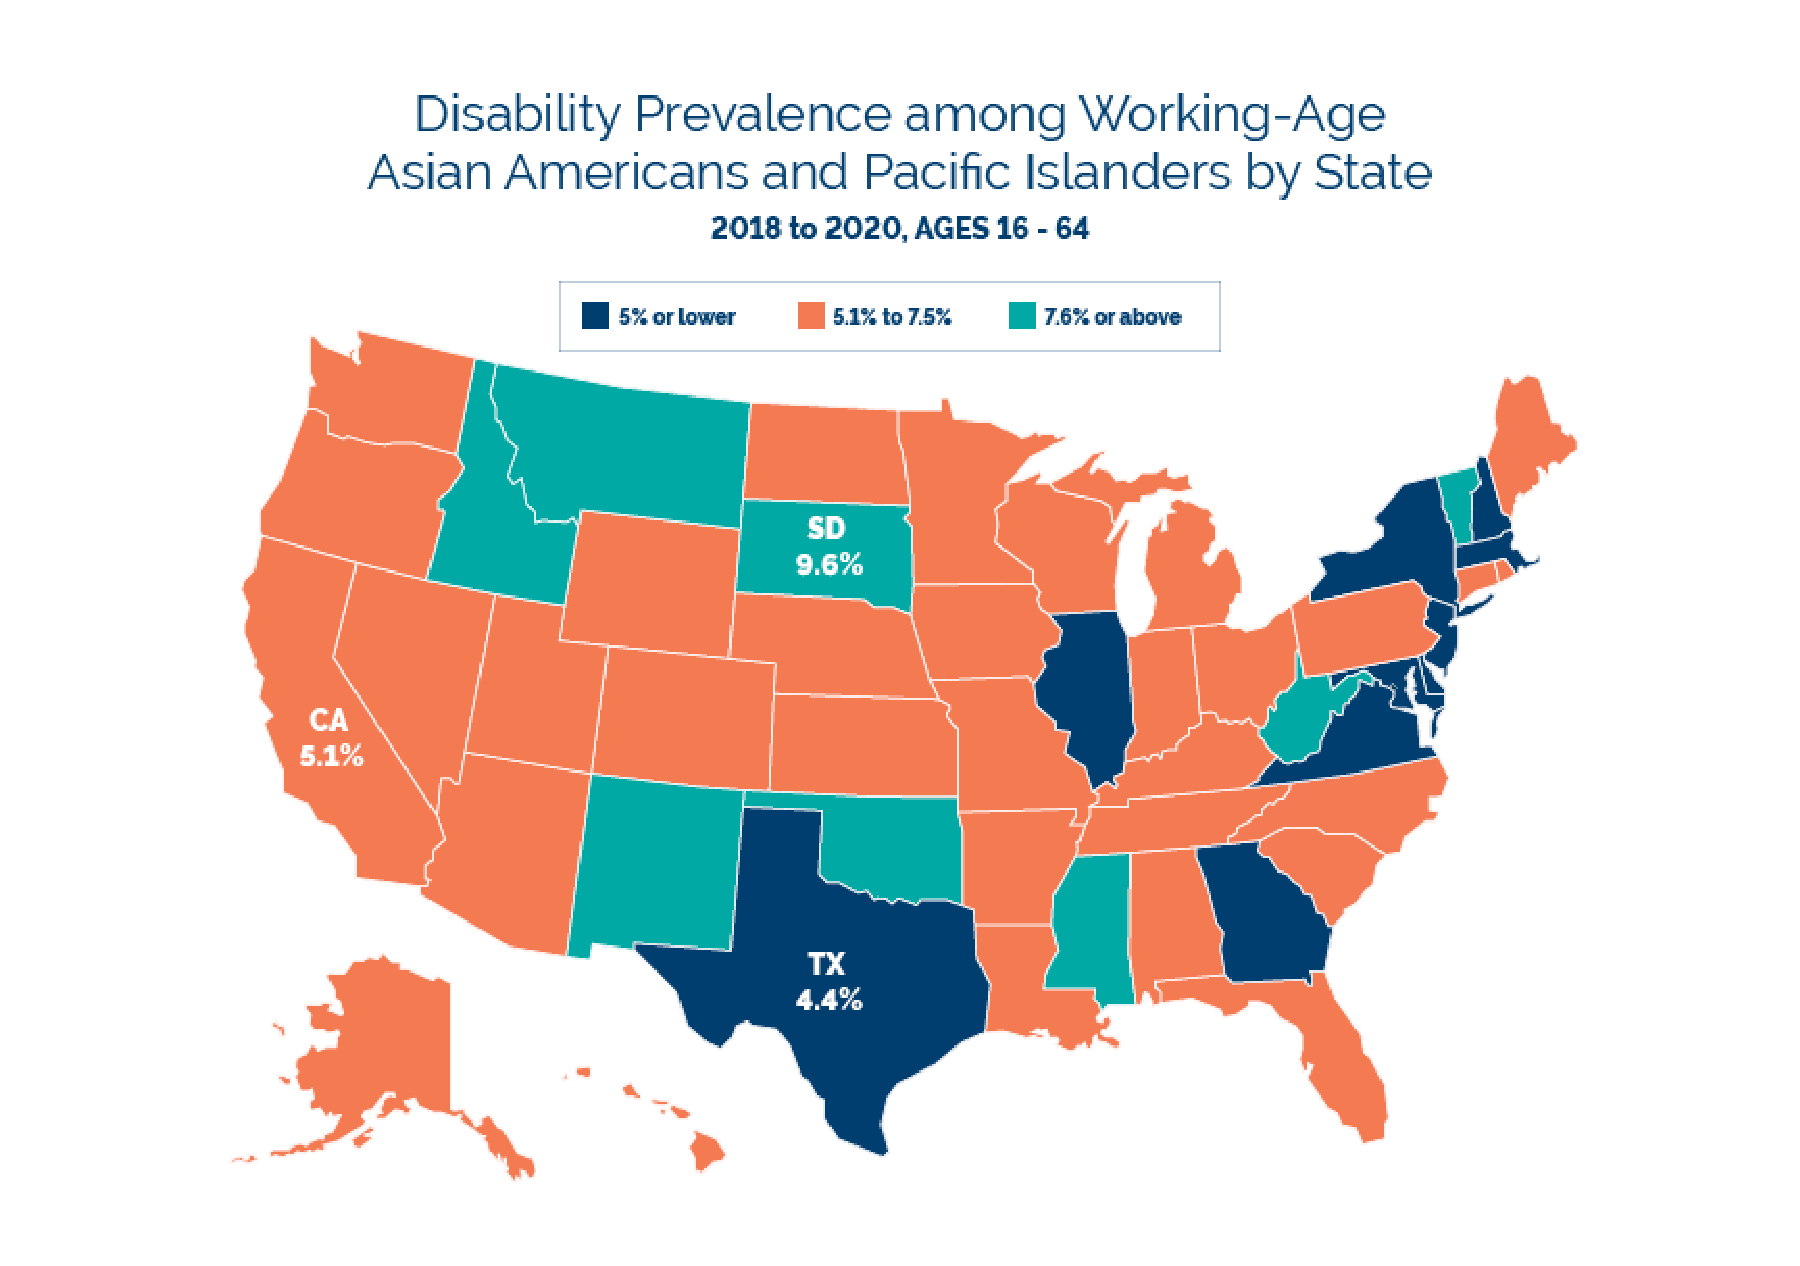
Disability Prevalence among Working-Age Asian Americans and Pacific Islanders by State – plain text
Q: What is one thing that you want employers to know about how to support current and future Asian Americans with disabilities in the workforce?
A: We’d say that an accommodating and fully accessible workplace is integral to supporting current and future Asian Americans with disabilities in the workforce. We believe employers should foster supportive working environments that acknowledge and embrace disability diversity for the many benefits it brings to an organization. For example, universal accommodations that anyone can use, such as captioning in virtual meetings, may benefit many employees. When it comes to both physical and digital infrastructure, employers should use universal design practices to ensure full access and usability.


Data notes: All figures are produced using the American Community Survey -year microdata. Disability status is based on answering affirmatively to at least one of six questions related to difficulty seeing, hearing, walking, concentrating, shopping, and dressing or bathing. Race and ancestry categories are non-exclusive (i.e., Asian and Pacific Islander population counts include those who have multiple racial identities, and someone who reports both Chinese and Vietnamese ancestry would be included in both Asian subgroups).
Justin Tsang is a disabled Chinese American and research director at AADI. Since 2018, he has been involved in disability advocacy in various settings, including the American Association of People with Disabilities, California Foundation for Independent Living Centers and Youth Organizing - Disabled and Proud. Justin is currently involved in housing policy research at San Francisco’s housing nonprofit, The Kelsey.
Hanna Lee is a disabled Korean American and a research intern at AADI. She is an art therapist and art educator living in Philadelphia.
Shruti Rajkumar is a disabled Indian-American and the director of advocacy at AADI. She recently graduated from Emerson College, where she studied journalism. In their time in college, they participated in multiple campaigns and leadership roles to advocate for disabled students of color.
Amy Fong is a mathematical statistician in the department’s Office of Disability Employment Policy.
Disability Prevalence by Age Group Among Asian Subgroups and Pacific Islanders – plain text:
| Asian Subgroup | Age Group | Disability Prevalence |
| Chinese | 5 to 17 | 2.9% |
| Chinese | 18 to 34 | 2.8% |
| Chinese | 35 to 64 | 3.7% |
| Chinese | 65 to 74 | 14.6% |
| Chinese | 75 and Older | 48.3% |
| Filipino | 5 to 17 | 4.0% |
| Filipino | 18 to 34 | 4.4% |
| Filipino | 35 to 64 | 6.6% |
| Filipino | 65 to 74 | 20.0% |
| Filipino | 75 and Older | 49.1% |
| Indian | 5 to 17 | 2.0% |
| Indian | 18 to 34 | 1.8% |
| Indian | 35 to 64 | 3.1% |
| Indian | 65 to 74 | 16.8% |
| Indian | 75 and Older | 41.2% |
| Japanese | 5 to 17 | 3.3% |
| Japanese | 18 to 34 | 5.1% |
| Japanese | 35 to 64 | 6.5% |
| Japanese | 65 to 74 | 14.6% |
| Japanese | 75 and Older | 46.8% |
| Korean | 5 to 17 | 3.1% |
| Korean | 18 to 34 | 4.4% |
| Korean | 35 to 64 | 4.7% |
| Korean | 65 to 74 | 11.6% |
| Korean | 75 and Older | 41.4% |
| Vietnamese | 5 to 17 | 3.2% |
| Vietnamese | 18 to 34 | 3.5% |
| Vietnamese | 35 to 64 | 6.4% |
| Vietnamese | 65 to 74 | 22.6% |
| Vietnamese | 75 and Older | 55.1% |
Disability Prevalence among Working-Age Asian Americans and Pacific Islanders by State – plain text:
| State | Disability Prevalence (Asian or Pacific Islander, ages 16 to 64) |
| Alabama | 6.6% |
| Alaska | 5.1% |
| Arizona | 5.8% |
| Arkansas | 7.4% |
| California | 5.1% |
| Colorado | 5.1% |
| Connecticut | 5.5% |
| Delaware | 4.3% |
| District of Columbia | 5.2% |
| Florida | 6.2% |
| Georgia | 4.3% |
| Hawaii | 7.5% |
| Idaho | 9.1% |
| Illinois | 4.2% |
| Indiana | 5.5% |
| Iowa | 5.8% |
| Kansas | 7.5% |
| Kentucky | 7.2% |
| Louisiana | 7.1% |
| Maine | 5.5% |
| Maryland | 4.8% |
| Massachusetts | 4.2% |
| Michigan | 5.2% |
| Minnesota | 6.9% |
| Mississippi | 8.1% |
| Missouri | 6.0% |
| Montana | 7.8% |
| Nebraska | 5.6% |
| Nevada | 7.2% |
| New Hampshire | 3.7% |
| New Jersey | 3.9% |
| New Mexico | 8.0% |
| New York | 4.7% |
| North Carolina | 5.3% |
| North Dakota | 5.2% |
| Ohio | 5.3% |
| Oklahoma | 7.7% |
| Oregon | 6.9% |
| Pennsylvania | 5.7% |
| Rhode Island | 6.6% |
| South Carolina | 6.7% |
| South Dakota | 9.6% |
| Tennessee | 6.3% |
| Texas | 4.4% |
| Utah | 5.7% |
| Vermont | 8.7% |
| Virginia | 4.3% |
| Washington | 5.5% |
| West Virginia | 8.7% |
| Wisconsin | 6.2% |
| Wyoming | 7.1% |
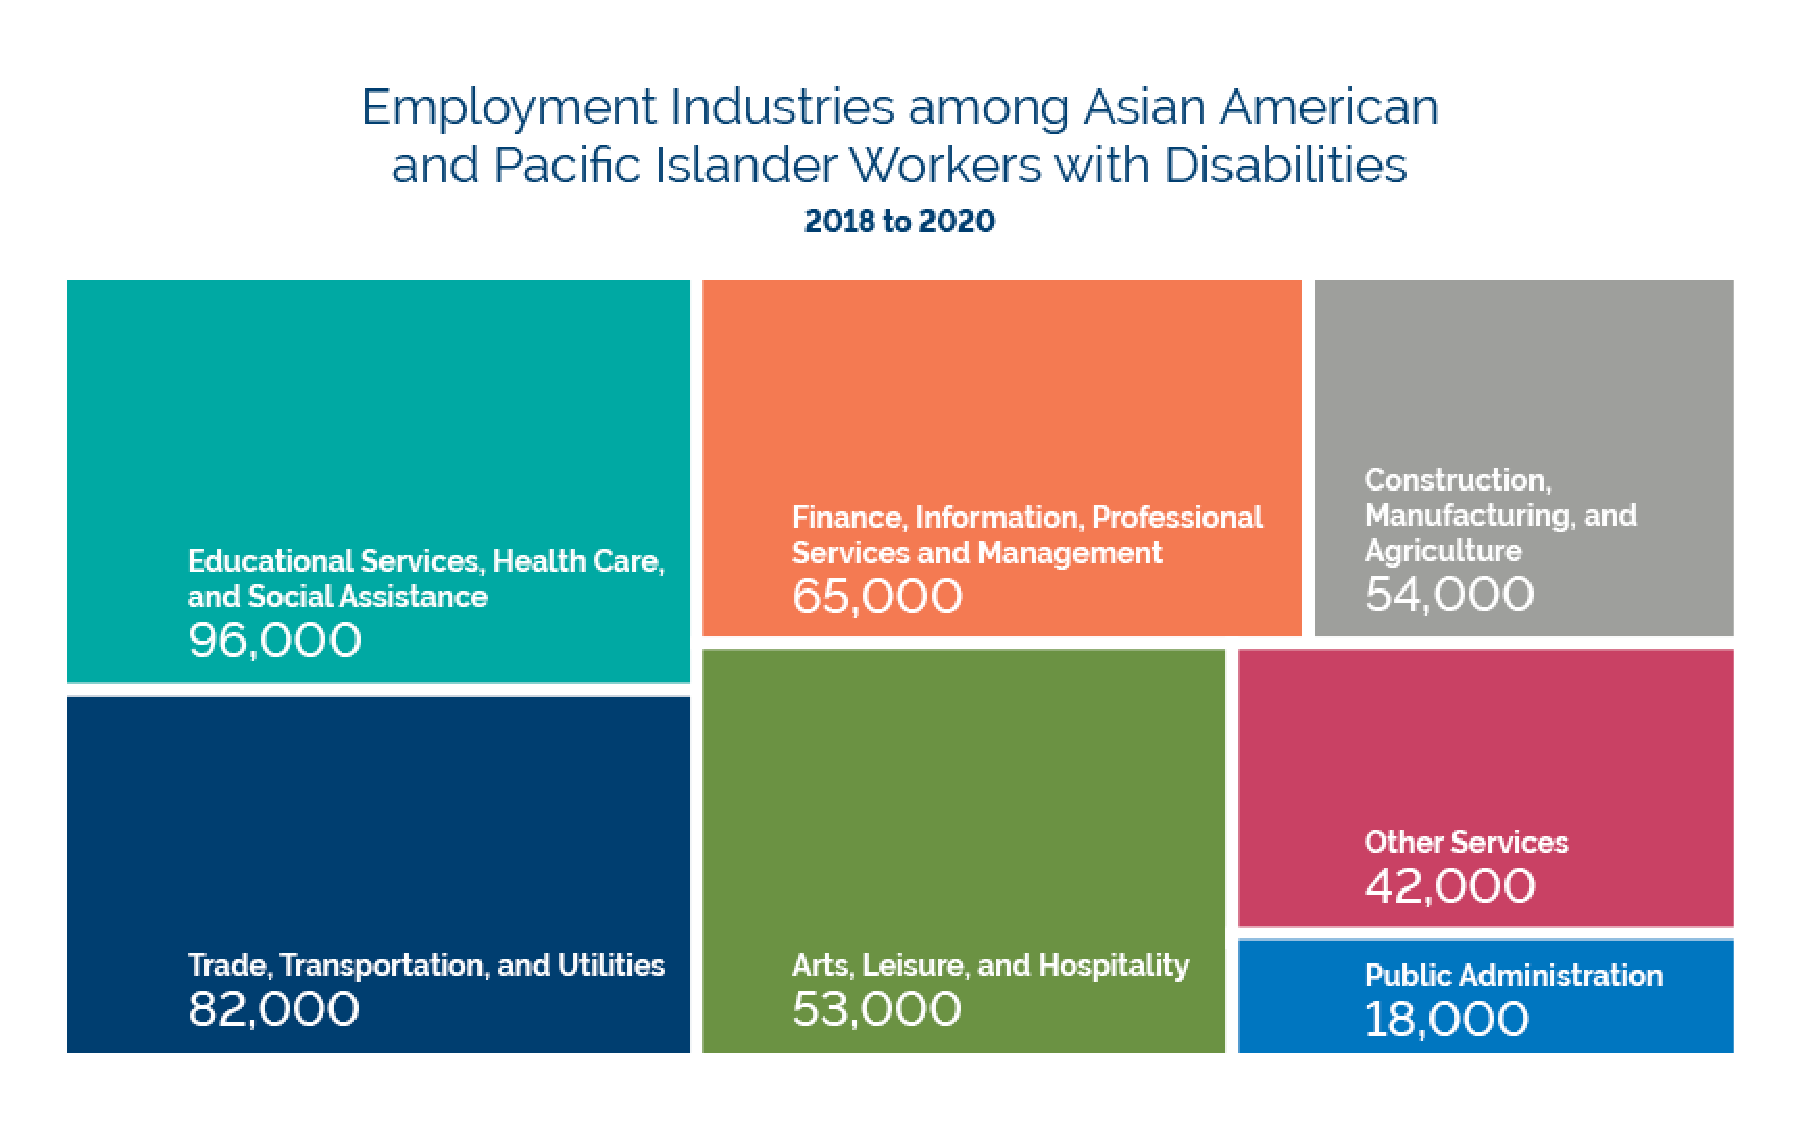
| Industry | Count: Asian Americans and Pacific Islanders Workers with Disabilities |
| Educational Services, Health Care and Social Assistance | 96,000 |
| Trade, Transportation and Utilities | 82,000 |
| Finance, Information, Professional Services and Management | 65,000 |
| Construction, Manufacturing and Agriculture | 54,000 |
| Arts, Leisure and Hospitality | 53,000 |
| Other Services | 42,000 |
| Public Administration | 18,000 |
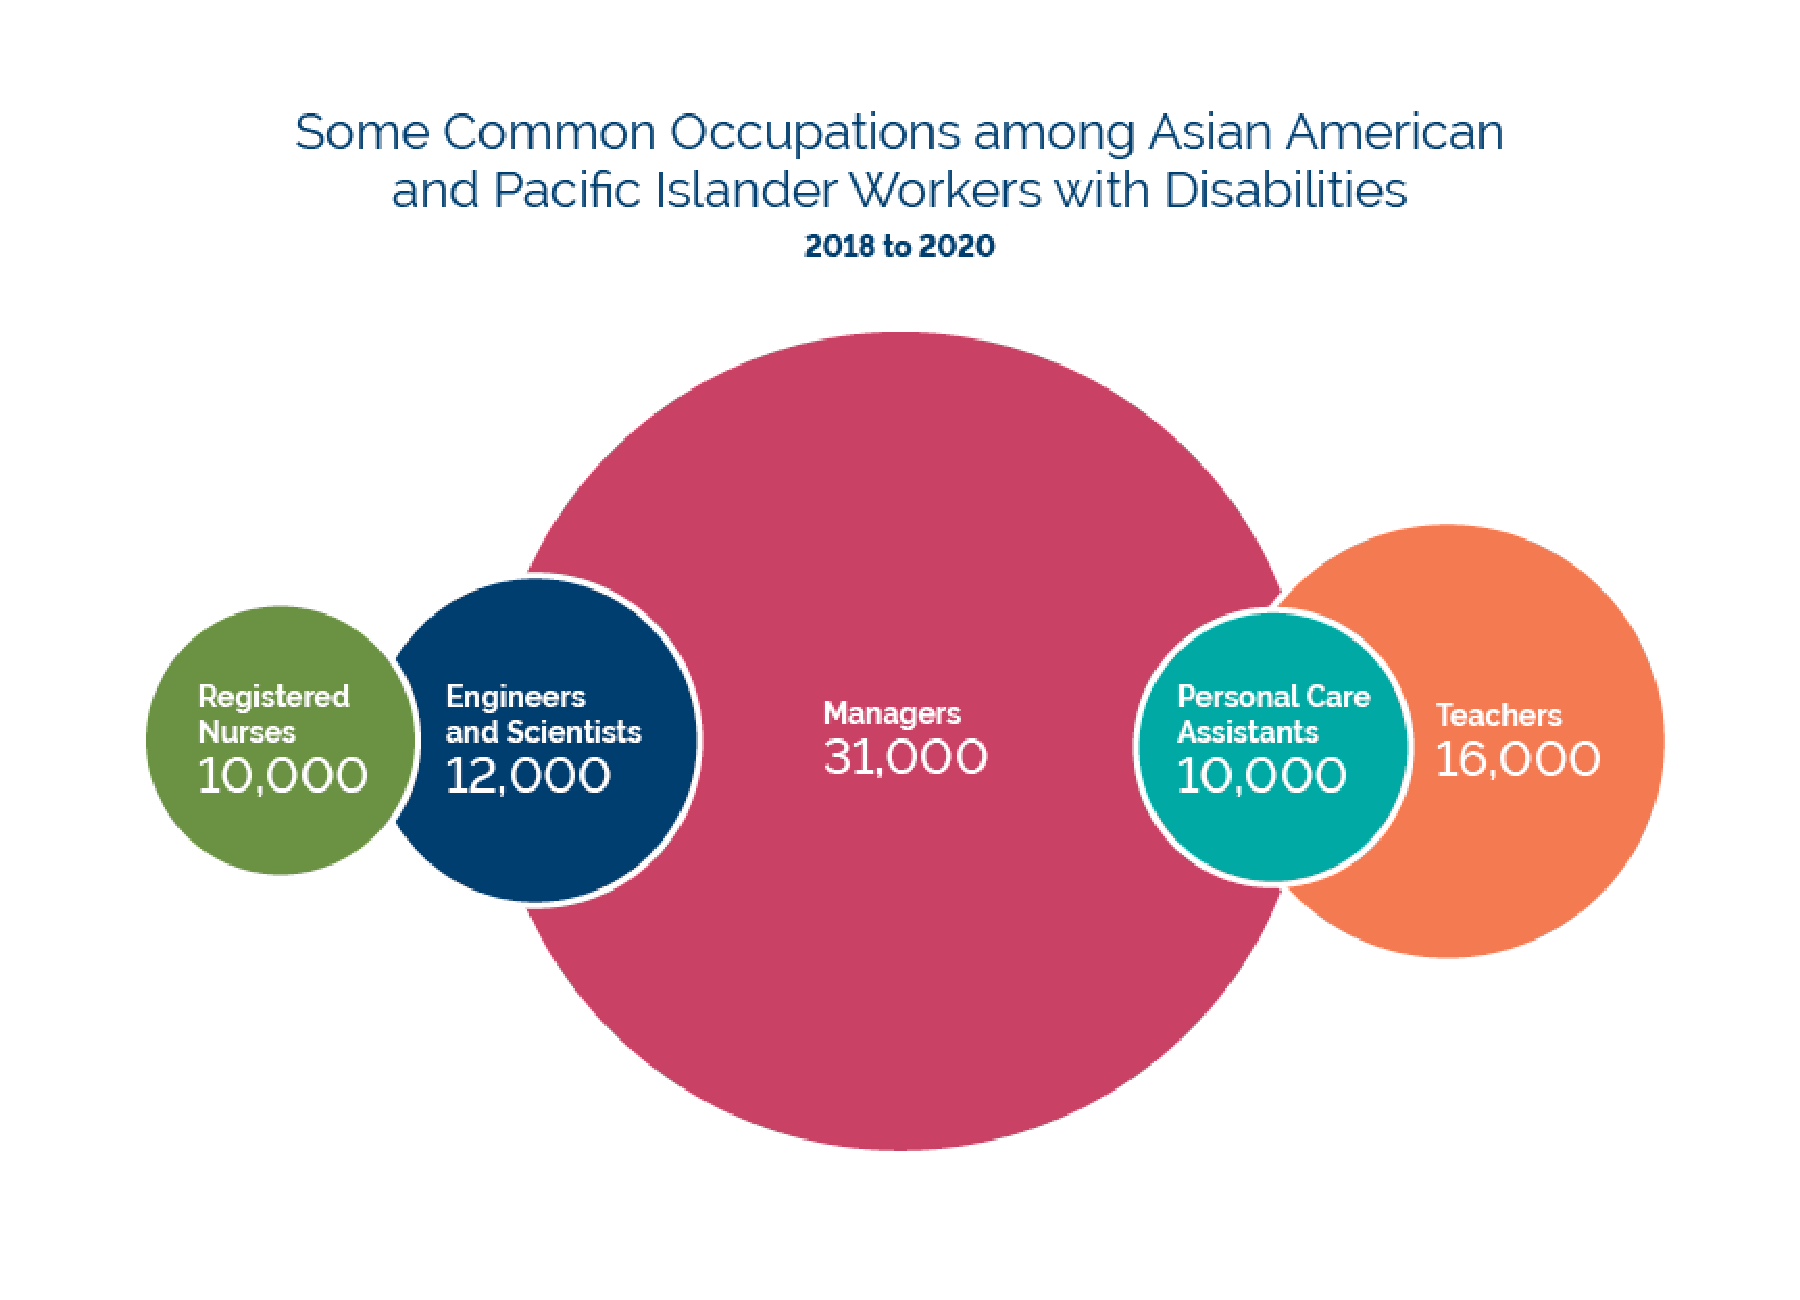
| Occupation | Count: Asian Americans and Pacific Islanders Workers with Disabilities |
| Registered Nurses | 10,000 |
| Engineers and Scientists | 12,000 |
| Managers | 31,000 |
| Personal Care Assistants | 10,000 |
| Teachers | 16,000 |

 U.S. Department of Labor Blog