How many Asian American, Native Hawaiian and Pacific Islanders with disabilities are working in skilled trade positions?
During Asian American, Native Hawaiian and Pacific Islander Heritage Month, we are spotlighting data on AA and NHPI workers with disabilities in skilled trade professions, which are critical for maintaining everyday infrastructure. These professions include the following major occupation groups:
• Production.
• Transportation.
• Construction, Extraction and Agriculture.
• Repair, Installation and Maintenance.
One of the Department of Labor’s high-priority program goals for advancing equity, justice and opportunity for Asian Americans, Native Hawaiians and Pacific Islanders (AA and NHPIs) is to publish labor force data separated out for AA and NHPI subgroups to better understand how they’re faring in the labor market.
This analysis is one in an ongoing series focusing on workers with disabilities in skilled trade professions in support of the Biden-Harris Administration’s Good Jobs Initiative. The initiative provides critical information to workers, employers, and government agencies as they work to improve job quality and create access to good jobs free from discrimination and harassment for all working people, with emphasis on underserved communities. Among the key findings are that 18% (approximately 56,000) AA and NHPI workers with disabilities are working in skilled trade professions.
As with previous analyses (focused on people with disabilities overall, disabled Black workers and disabled women workers), these data were extracted from the Census Bureau’s American Community Survey for 2017 through 2021. The industry codes and groupings come from the Standard Occupational Classification System, which is a federal statistical standard that is used to group workers into different occupations based on job titles.
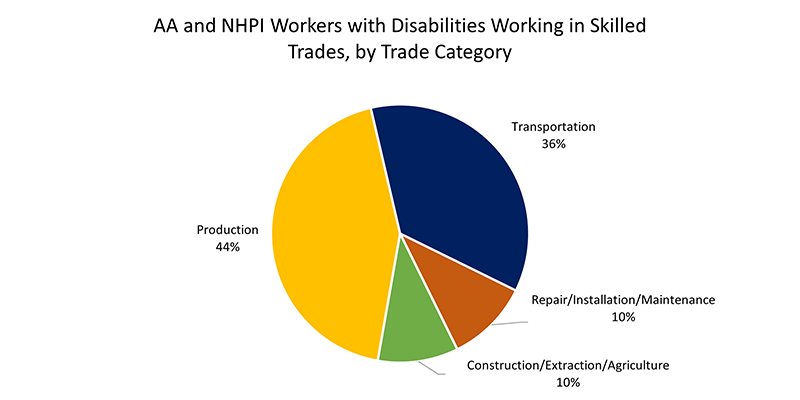
What types of skilled trade professions are most common among AA and NHPI workers with disabilities?
As the pie chart below shows, most disabled AA and NHPI workers employed in skilled trades are working in production (44%) or transportation (36%). The least most common categories are construction/extraction/agriculture (10%) and repair/installation/maintenance (10%).
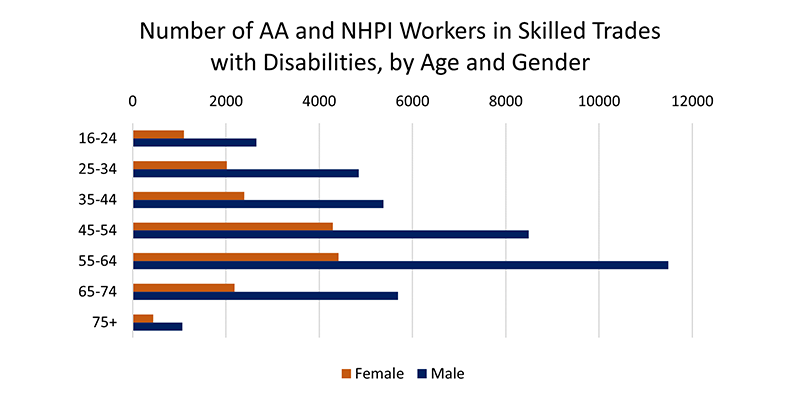
What are the age distributions of AA and NHPI workers in skilled trades with disabilities, separated out by gender?
As the bar chart below shows, the largest group of disabled AA and NHPI workers employed in skilled trades are men aged 55-64. In every age group, the number of disabled AA and NHPI men in skilled trades is larger than the number of disabled AA and NHPI women in skilled trades.
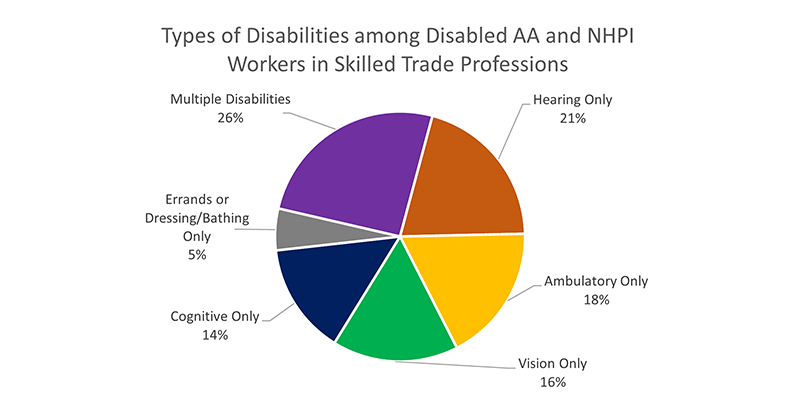
What types of disabilities are most common for disabled AA and NHPI workers who are employed in skilled trades?
As the pie chart below shows, more than a quarter of disabled AA and NHPI workers in skilled trades report having multiple disabilities (26%). For those who report having only one type of disability, the most common is hearing difficulties (21%) followed by ambulatory difficulties (18%), vision difficulties (16%), cognitive difficulties (14%), and errands or dressing/bathing difficulties (5%).
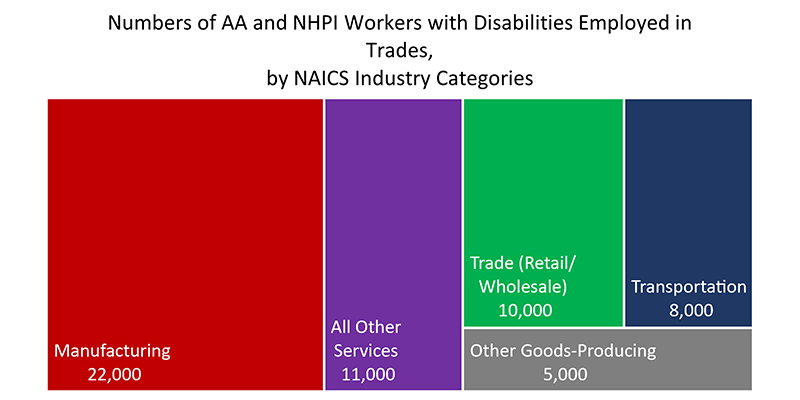
What are the main trade industries that employ AA and NHPI workers with disabilities?
A detailed look at the distribution of workers in skilled trades across different industries using the North American Industry Classification System shows that most disabled AA and NHPI workers in skilled trades are working in the manufacturing industry, numbering around 22,000 workers. The components of this chart are defined by industry of employer, as opposed to the occupation or function of the employee.
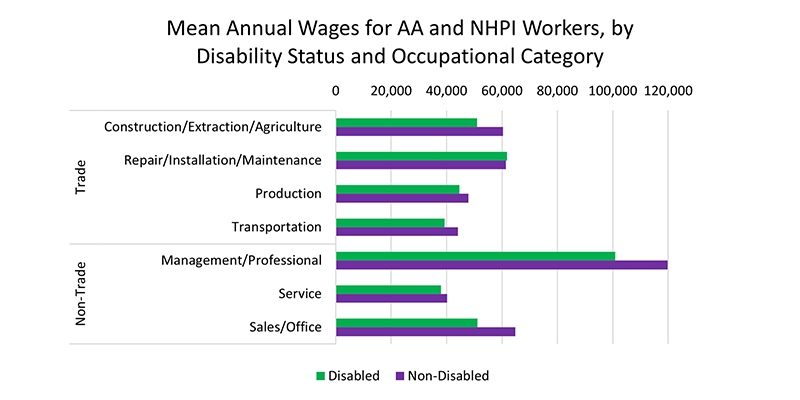
What are the wage gaps between disabled and non-disabled AA and NHPI workers in different occupational categories, including both skilled trades and other professions?
The smallest wage gap between AA and NHPI workers with disabilities versus those without disabilities can be found in Repair/Installation/Maintenance, a skilled trade occupational category. Wage gaps between disabled and non-disabled AA and NHPI workers are larger overall in non-trade categories such as Management and Service professions. Note: These data are restricted to employees who work full-time (usually worked at least 35 hours per week), worked at least 50 weeks in the last year, and have positive earnings.
David Rosenblum is a senior economist and Alexandra Ruth is a data scientist in the department’s Office of Disability Employment Policy.