How many people with disabilities are working in skilled trades?
Disabled people work in a wide variety of occupations and industries. For this data blog, we are spotlighting people with disabilities who work in skilled trade professions by taking a deep dive into national employment and occupation data on disabled people.
Skilled trade jobs require specialized training and involve a combination of rigorous physical and mental labor. These jobs are critical for maintaining everyday infrastructure and include the following major occupation groups:
- Farming, fishing, forestry and extraction
- Construction
- Installation, Maintenance and Repair
- Production
- Transportation and Material Moving
The following figures use data from the Census Bureau’s American Community Survey for 2017 through 2021. The industry codes are derived from the Standard Occupational Classification System, which is a federal statistical standard that is used to group workers into different occupations based on job titles. Note: For brevity, occupations in the categories of farming, fishing, forestry or extraction are labelled “Primary Sector” in the charts and tables, where primary sector refers to the acquisition of natural resources.
***
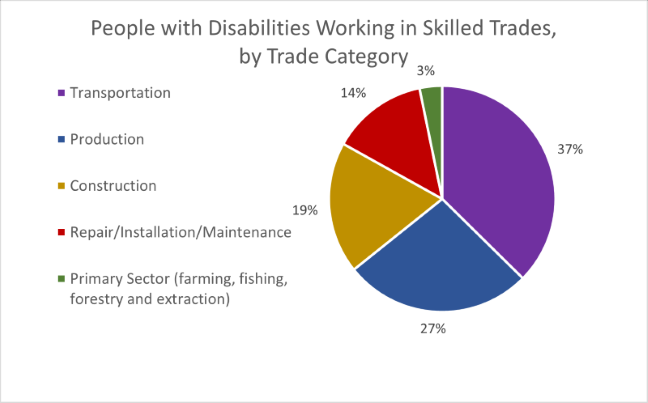
Around one-quarter of employed people with disabilities are working in skilled trades. Of disabled people working in skilled trade professions, the largest proportion are working in transportation. All five categories of trades have a higher proportion of workers with disabilities than non-trades occupations as a single category.
| Where Disabled People Are Working | Number | Percent |
|---|---|---|
| In Trade Professions | 2,387,832 | 25.1% |
| In Non-Trade Professions | 7,132,000 | 74.9% |
| In All Professions | 9,519,832 | 100% |
| Occupational Category | Percent |
|---|---|
| Primary Sector | 6.5% |
| Construction | 5.9% |
| Repair/Installation/Maintenance | 6.8% |
| Production | 7.4% |
| Transportation% | 7.8% |
| All Occupations Other Than Trades | 5.8% |
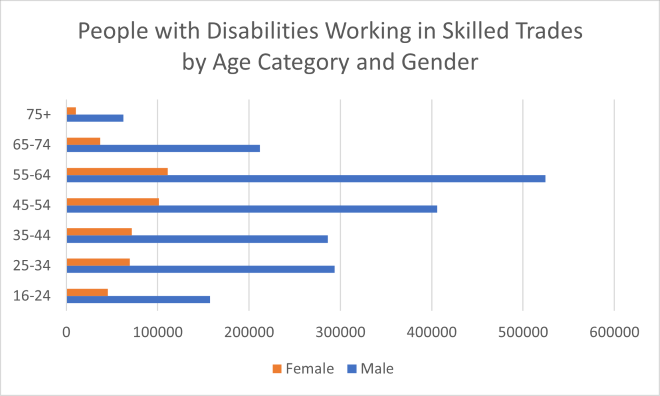
Women tend to make up approximately one-fifth of disabled people ages 16 through 54 who are employed in trades.
| Age | Male | Female | Total | Percent Female |
|---|---|---|---|---|
| 16-24 | 157,397 | 45,362 | 202,759 | 22% |
| 25-34 | 293,501 | 69,228 | 362,729 | 19% |
| 35-44 | 286,124 | 71,512 | 357,636 | 20% |
| 45-54 | 405,814 | 101,345 | 507,159 | 20% |
| 55-64 | 524,551 | 110,888 | 635,439 | 17% |
| 65-74 | 212,072 | 37,152 | 249,224 | 15% |
| 75+ | 62,311 | 10,575 | 72,886 | 15% |
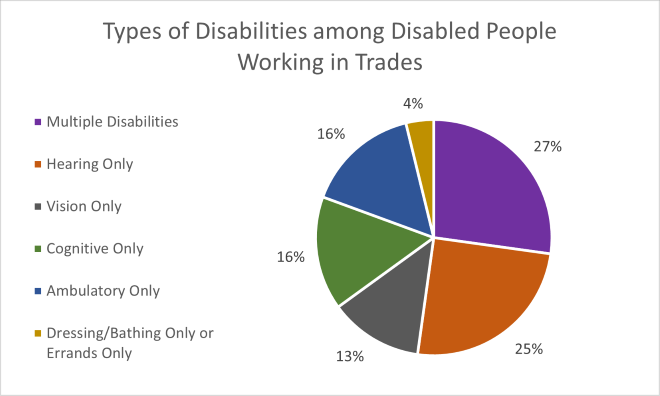
More than one-quarter of employed disabled people working in trades report having multiple disabilities. Of adults with disabilities working in trades who report only one disability, the most commonly reported disability is hearing difficulty.
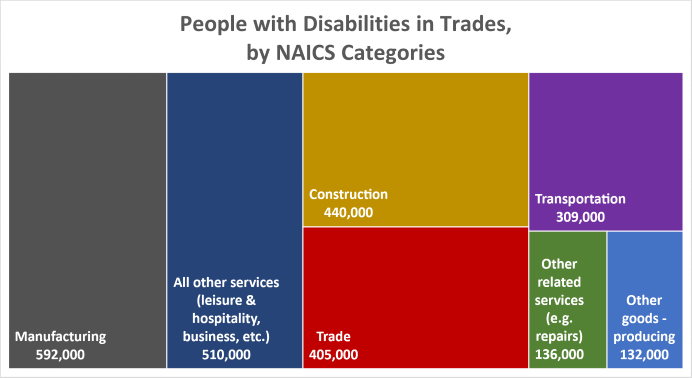
A detailed look at different subcategories of trade industries using the North American Industry Classification System (NAICS) shows that most disabled people working in trades are working in the industries of manufacturing, construction, trade (retail or wholesale) and transportation.
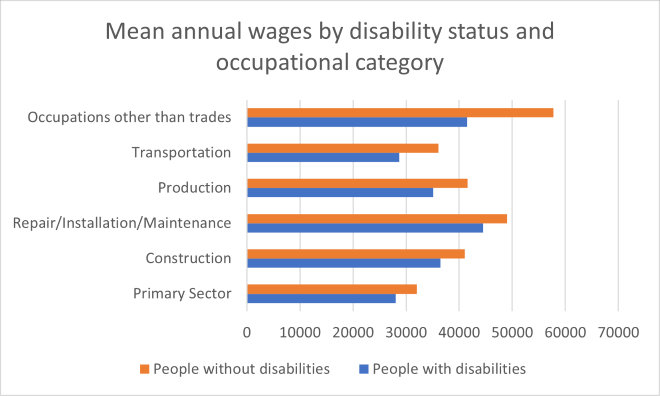
The 17% wage gap for disabled people compared to people without disabilities is smaller on average for trade professions than the 28% average wage gap for other occupations. Note: This figure does not control for part-time vs. full-time work or any other characteristics of workers, employers or jobs.
David Rosenblum is a senior economist and Alexandra Ruth is a data scientist in the department’s Office of Disability Employment Policy.