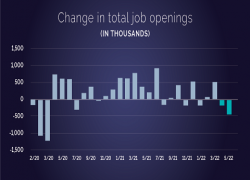
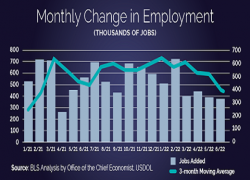
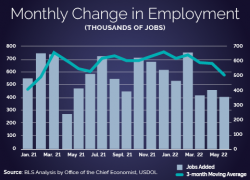
The July jobs report marked two new milestones in the economic recovery: First, the number of Americans working exceeded the pre-pandemic number, as the economy added 528,000 jobs in July with a three-month moving average of 437,000. Second, the unemployment rate is 3.5%, back to its pre-pandemic low, which matched the lowest unemployment rate in 50 years. The total number of unemployed workers (5.67 million) is lower than it was in February 2020 (5.72 million).
The speed of this job's recovery has been remarkable. Since the president and Congress took office in January 2021, the economy has added 9.5 million new jobs. In early July, we learned the economy completely recovered all the private-sector jobs lost in the pandemic recession in just over two years. That’s faster than the past three recoveries. The faster-than-expected recovery of the total number of jobs lost during the pandemic is the latest good news from the fast, but steadying job growth we’ve seen over the last several months. However, the July job growth was a significant break from the second quarter average of 375,000, and one month of data is not enough to determine a change in the trend.
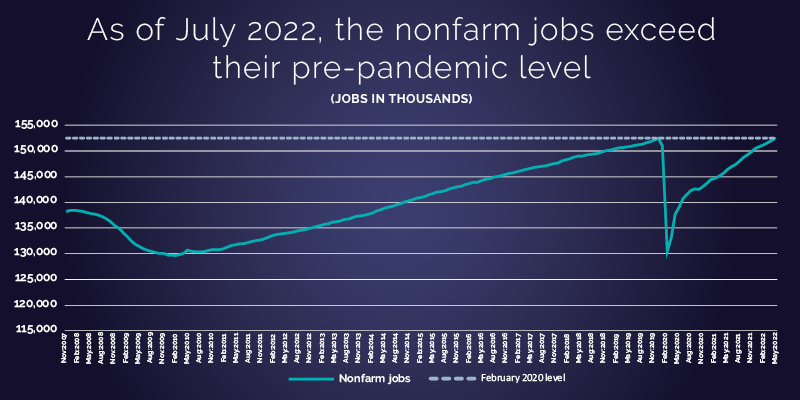
As of July 2022, the nonfarm jobs exceed their pre-pandemic level– accessible version
Racial unemployment gaps and the recovery
The Biden-Harris administration and the U.S. Department of Labor are committed to an equitable economic recovery. We regularly monitor economic indicators by race, gender, education and other statuses and identities. In this report, we looked specifically at the relative changes in the racial unemployment rate gaps overall and by gender.
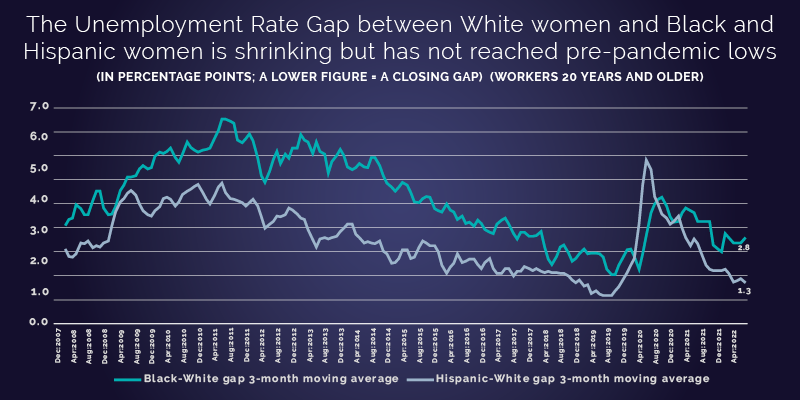
Racial unemployment rate gaps between Black and white workers and Hispanic and white workers have been trending down quickly. With the July report, the Hispanic-white gap narrowed further. The Black unemployment rate ticked up (though not statistically significantly) and the Black-white gap, therefore, increased. This is in line with the fast recovery and tight labor market (at least when looking at the unemployment rate to vacancy ratio). Note the Asian-American gap is not included below because the Asian-American unemployment rate tends to be lower than the white rate. Monthly sample sizes are too small to disaggregate the Asian-American rate at the monthly level. However, there is likely significant variation.
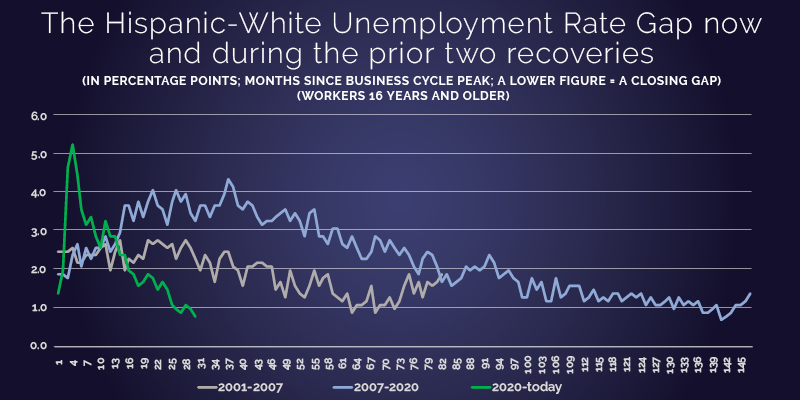
The Hispanic-White Unemployment Rate Gap now and during the prior two recoveries– accessible version
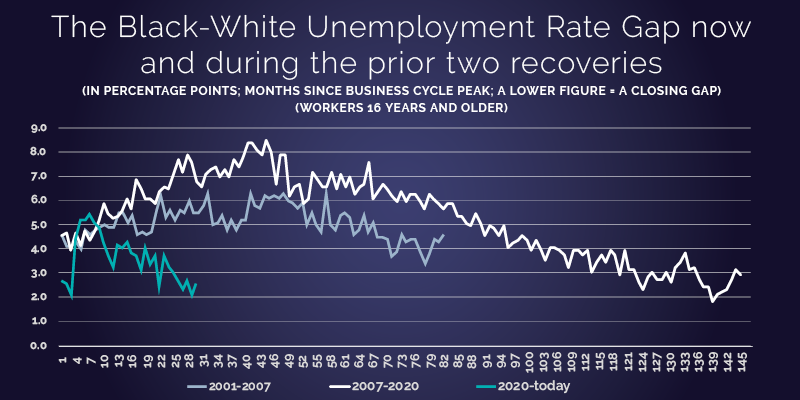
The Black-White Unemployment Rate Gap now and during the prior two recoveries– accessible version
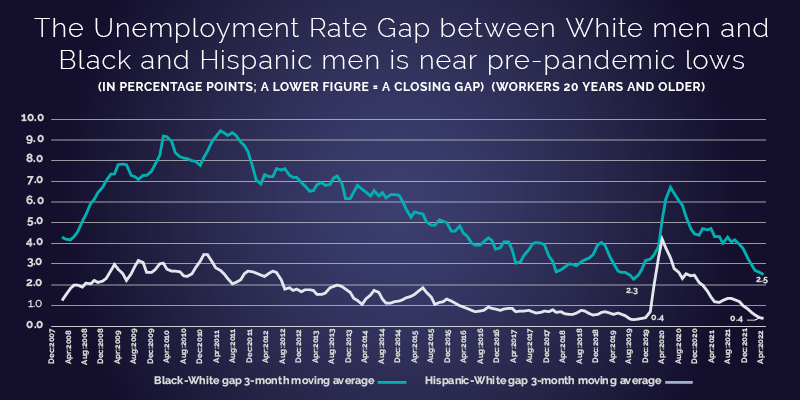
The speed by which the unemployment gap is closing varies by gender. The gaps for Hispanic men and Black men are at or below their pre-pandemic lows. Notably, Black men and Hispanic men’s employment-to-population shares recently have been at or near fully recovered for several months (though they both fell in July, a departure from trend that should be monitored). Whereas the share for white men has not yet reached the pre-pandemic share.
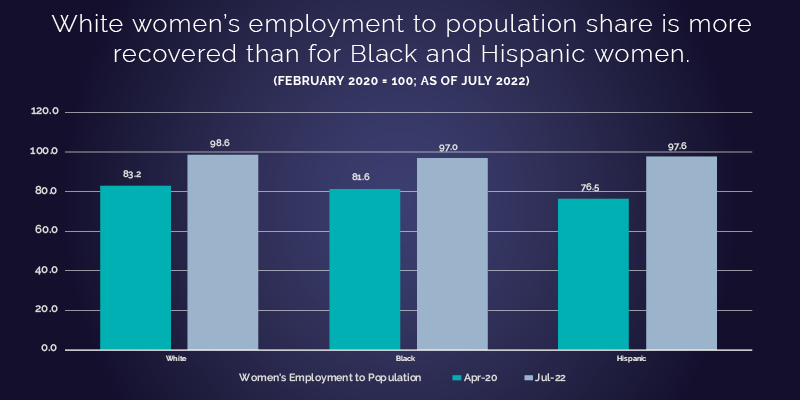
For women, the gaps have not closed as much, though we’re seeing some progress. Notably, the employment-to-population share dynamic for white, Black and Hispanic women has been the reverse for several months, driven by differences in labor-force participation and employment rates. The July report did include some positive employment news for women: the 3-month moving average (in the chart) ticked up. The Black-white gap for women remained the same in July as the Black women’s unemployment rate fell. Hispanic women’s unemployment rate fell to a historic low of 3.2%. And, both Black and Hispanic women’s employment-to-population ratios increased by +0.4 and +0.8 percentage points respectively.
The differences between men and women could be driven by the sectoral composition of the recovery, with sectors with a higher share of women working still below their pre-pandemic levels. But access to care and the effects of long COVID-19 on family dynamics may also be playing a role as the recovery has been slower for women than men. Notably, the labor-force participation rates for both prime-age men and women, particularly those without college degrees, still have room to improve.
This strong July jobs report reinforces the urgency of the administration’s goal of investing in America’s workers. The outlook grows brighter as the president prepares to sign the CHIPS and Science Act into law and following the passage of the Inflation Reduction Act, which will create thousands of jobs, address our climate crisis and lower costs for families in every community.
Joelle Gamble is the chief economist for the U.S. Department of Labor.
| Month and Year | Jobs Added |
| Nov:2007 | 138284 |
| Dec:2007 | 138392 |
| Jan:2008 | 138403 |
| Feb:2008 | 138324 |
| Mar:2008 | 138275 |
| Apr:2008 | 138035 |
| May:2008 | 137858 |
| Jun:2008 | 137687 |
| Jul:2008 | 137491 |
| Aug:2008 | 137213 |
| Sep:2008 | 136753 |
| Oct:2008 | 136272 |
| Nov:2008 | 135545 |
| Dec:2008 | 134839 |
| Jan:2009 | 134055 |
| Feb:2009 | 133312 |
| Mar:2009 | 132512 |
| Apr:2009 | 131817 |
| May:2009 | 131475 |
| Jun:2009 | 131008 |
| Jul:2009 | 130668 |
| Aug:2009 | 130485 |
| Sep:2009 | 130244 |
| Oct:2009 | 130045 |
| Nov:2009 | 130057 |
| Dec:2009 | 129788 |
| Jan:2010 | 129790 |
| Feb:2010 | 129698 |
| Mar:2010 | 129879 |
| Apr:2010 | 130110 |
| May:2010 | 130650 |
| Jun:2010 | 130511 |
| Jul:2010 | 130427 |
| Aug:2010 | 130422 |
| Sep:2010 | 130357 |
| Oct:2010 | 130625 |
| Nov:2010 | 130750 |
| Dec:2010 | 130822 |
| Jan:2011 | 130841 |
| Feb:2011 | 131053 |
| Mar:2011 | 131288 |
| Apr:2011 | 131602 |
| May:2011 | 131703 |
| Jun:2011 | 131939 |
| Jul:2011 | 131999 |
| Aug:2011 | 132125 |
| Sep:2011 | 132358 |
| Oct:2011 | 132562 |
| Nov:2011 | 132694 |
| Dec:2011 | 132896 |
| Jan:2012 | 133250 |
| Feb:2012 | 133512 |
| Mar:2012 | 133752 |
| Apr:2012 | 133834 |
| May:2012 | 133934 |
| Jun:2012 | 134007 |
| Jul:2012 | 134159 |
| Aug:2012 | 134331 |
| Sep:2012 | 134518 |
| Oct:2012 | 134677 |
| Nov:2012 | 134833 |
| Dec:2012 | 135072 |
| Jan:2013 | 135263 |
| Feb:2013 | 135541 |
| Mar:2013 | 135680 |
| Apr:2013 | 135871 |
| May:2013 | 136093 |
| Jun:2013 | 136274 |
| Jul:2013 | 136386 |
| Aug:2013 | 136628 |
| Sep:2013 | 136815 |
| Oct:2013 | 137040 |
| Nov:2013 | 137304 |
| Dec:2013 | 137373 |
| Jan:2014 | 137548 |
| Feb:2014 | 137714 |
| Mar:2014 | 137968 |
| Apr:2014 | 138293 |
| May:2014 | 138511 |
| Jun:2014 | 138837 |
| Jul:2014 | 139069 |
| Aug:2014 | 139257 |
| Sep:2014 | 139566 |
| Oct:2014 | 139818 |
| Nov:2014 | 140109 |
| Dec:2014 | 140377 |
| Jan:2015 | 140568 |
| Feb:2015 | 140839 |
| Mar:2015 | 140910 |
| Apr:2015 | 141194 |
| May:2015 | 141525 |
| Jun:2015 | 141699 |
| Jul:2015 | 142001 |
| Aug:2015 | 142126 |
| Sep:2015 | 142281 |
| Oct:2015 | 142587 |
| Nov:2015 | 142824 |
| Dec:2015 | 143097 |
| Jan:2016 | 143205 |
| Feb:2016 | 143417 |
| Mar:2016 | 143654 |
| Apr:2016 | 143851 |
| May:2016 | 143892 |
| Jun:2016 | 144150 |
| Jul:2016 | 144521 |
| Aug:2016 | 144664 |
| Sep:2016 | 144953 |
| Oct:2016 | 145071 |
| Nov:2016 | 145201 |
| Dec:2016 | 145415 |
| Jan:2017 | 145628 |
| Feb:2017 | 145818 |
| Mar:2017 | 145960 |
| Apr:2017 | 146165 |
| May:2017 | 146388 |
| Jun:2017 | 146585 |
| Jul:2017 | 146768 |
| Aug:2017 | 146913 |
| Sep:2017 | 147012 |
| Oct:2017 | 147153 |
| Nov:2017 | 147353 |
| Dec:2017 | 147529 |
| Jan:2018 | 147662 |
| Feb:2018 | 148064 |
| Mar:2018 | 148289 |
| Apr:2018 | 148468 |
| May:2018 | 148801 |
| Jun:2018 | 148984 |
| Jul:2018 | 149050 |
| Aug:2018 | 149269 |
| Sep:2018 | 149326 |
| Oct:2018 | 149471 |
| Nov:2018 | 149573 |
| Dec:2018 | 149821 |
| Jan:2019 | 150100 |
| Feb:2019 | 150124 |
| Mar:2019 | 150348 |
| Apr:2019 | 150636 |
| May:2019 | 150713 |
| Jun:2019 | 150843 |
| Jul:2019 | 150921 |
| Aug:2019 | 151081 |
| Sep:2019 | 151244 |
| Oct:2019 | 151337 |
| Nov:2019 | 151589 |
| Dec:2019 | 151789 |
| Jan:2020 | 152128 |
| Feb:2020 | 152504 |
| Mar:2020 | 151006 |
| Apr:2020 | 130513 |
| May:2020 | 133155 |
| Jun:2020 | 137660 |
| Jul:2020 | 139048 |
| Aug:2020 | 140713 |
| Sep:2020 | 141632 |
| Oct:2020 | 142279 |
| Nov:2020 | 142612 |
| Dec:2020 | 142497 |
| Jan:2021 | 143017 |
| Feb:2021 | 143727 |
| Mar:2021 | 144431 |
| Apr:2021 | 144694 |
| May:2021 | 145141 |
| Jun:2021 | 145698 |
| Jul:2021 | 146387 |
| Aug:2021 | 146904 |
| Sep:2021 | 147328 |
| Oct:2021 | 148005 |
| Nov:2021 | 148652 |
| Dec:2021 | 149240 |
| Jan:2022 | 149744 |
| Feb:2022 | 150458 |
| Mar:2022 | 150856 |
| Apr:2022 | 151224 |
| May:2022 | 151608 |
| Jun:2022 | 151980 |
The Hispanic-White Unemployment Rate Gap now and during the prior two recoveries– accessible version
| Months since business cycle peak | 2001-2007 | 2007-2020 | 2020-today |
| 1 | 2.5 | 1.9 | 1.4 |
| 2 | 2.5 | 1.9 | 2.0 |
| 3 | 2.5 | 1.8 | 4.7 |
| 4 | 2.6 | 2.4 | 5.3 |
| 5 | 2.2 | 2.7 | 4.5 |
| 6 | 2.2 | 2.1 | 3.6 |
| 7 | 2.4 | 2.6 | 3.2 |
| 8 | 2.4 | 2.3 | 3.4 |
| 9 | 2.4 | 2.6 | 2.9 |
| 10 | 2.6 | 2.6 | 2.6 |
| 11 | 2.7 | 2.9 | 3.3 |
| 12 | 2.0 | 2.5 | 2.9 |
| 13 | 2.5 | 2.7 | 2.9 |
| 14 | 2.8 | 3.0 | 2.4 |
| 15 | 2.0 | 3.7 | 2.4 |
| 16 | 2.3 | 3.7 | 2.0 |
| 17 | 2.2 | 3.3 | 1.9 |
| 18 | 2.4 | 3.8 | 1.6 |
| 19 | 2.3 | 3.4 | 1.7 |
| 20 | 2.8 | 3.8 | 1.9 |
| 21 | 2.7 | 4.1 | 1.8 |
| 22 | 2.8 | 3.7 | 1.5 |
| 23 | 2.7 | 3.6 | 1.7 |
| 24 | 2.6 | 3.2 | 1.5 |
| 25 | 2.7 | 3.8 | 1.1 |
| 26 | 2.3 | 4.1 | 1.0 |
| 27 | 2.6 | 3.8 | 0.9 |
| 28 | 2.8 | 4.0 | 1.1 |
| 29 | 2.6 | 3.5 | 1.0 |
| 30 | 2.3 | 3.3 | 0.8 |
| 31 | 2.0 | 3.7 | |
| 32 | 2.4 | 3.7 | |
| 33 | 2.2 | 3.4 | |
| 34 | 1.7 | 3.7 | |
| 35 | 2.3 | 3.7 | |
| 36 | 2.5 | 4.0 | |
| 37 | 2.5 | 4.4 | |
| 38 | 2.1 | 4.2 | |
| 39 | 2.0 | 3.7 | |
| 40 | 1.6 | 3.6 | |
| 41 | 2.1 | 3.8 | |
| 42 | 2.1 | 3.7 | |
| 43 | 2.2 | 3.4 | |
| 44 | 2.2 | 3.2 | |
| 45 | 2.1 | 3.3 | |
| 46 | 2.1 | 3.3 | |
| 47 | 1.5 | 3.4 | |
| 48 | 1.7 | 3.5 | |
| 49 | 1.3 | 3.6 | |
| 50 | 2.0 | 3.3 | |
| 51 | 1.6 | 3.5 | |
| 52 | 1.4 | 3.3 | |
| 53 | 1.3 | 2.9 | |
| 54 | 1.6 | 3.5 | |
| 55 | 2.0 | 3.6 | |
| 56 | 1.6 | 2.9 | |
| 57 | 1.8 | 2.9 | |
| 58 | 1.9 | 2.7 | |
| 59 | 1.4 | 3.1 | |
| 60 | 1.3 | 3.1 | |
| 61 | 1.2 | 2.7 | |
| 62 | 1.4 | 2.6 | |
| 63 | 0.9 | 2.9 | |
| 64 | 1.1 | 2.6 | |
| 65 | 1.1 | 2.3 | |
| 66 | 1.2 | 2.3 | |
| 67 | 1.6 | 2.5 | |
| 68 | 0.9 | 2.9 | |
| 69 | 1.1 | 2.8 | |
| 70 | 1.1 | 2.5 | |
| 71 | 1.3 | 2.8 | |
| 72 | 1.0 | 2.6 | |
| 73 | 1.2 | 2.4 | |
| 74 | 1.6 | 2.6 | |
| 75 | 1.9 | 2.4 | |
| 76 | 1.4 | 2.1 | |
| 77 | 1.7 | 1.9 | |
| 78 | 1.3 | 2.3 | |
| 79 | 1.7 | 2.5 | |
| 80 | 1.6 | 2.4 | |
| 81 | 1.7 | 2.1 | |
| 82 | 1.9 | 1.7 | |
| 83 | 1.9 | ||
| 84 | 1.6 | ||
| 85 | 1.7 | ||
| 86 | 1.8 | ||
| 87 | 2.1 | ||
| 88 | 2.0 | ||
| 89 | 2.1 | ||
| 90 | 2.0 | ||
| 91 | 2.1 | ||
| 92 | 2.4 | ||
| 93 | 2.2 | ||
| 94 | 1.8 | ||
| 95 | 1.9 | ||
| 96 | 2.0 | ||
| 97 | 1.8 | ||
| 98 | 1.7 | ||
| 99 | 1.3 | ||
| 100 | 1.3 | ||
| 101 | 1.8 | ||
| 102 | 1.5 | ||
| 103 | 1.7 | ||
| 104 | 1.2 | ||
| 105 | 1.2 | ||
| 106 | 1.8 | ||
| 107 | 1.3 | ||
| 108 | 1.4 | ||
| 109 | 1.6 | ||
| 110 | 1.6 | ||
| 111 | 1.6 | ||
| 112 | 1.2 | ||
| 113 | 1.3 | ||
| 114 | 1.5 | ||
| 115 | 1.2 | ||
| 116 | 1.3 | ||
| 117 | 1.2 | ||
| 118 | 1.4 | ||
| 119 | 1.4 | ||
| 120 | 1.2 | ||
| 121 | 1.3 | ||
| 122 | 1.4 | ||
| 123 | 1.3 | ||
| 124 | 1.4 | ||
| 125 | 1.1 | ||
| 126 | 1.3 | ||
| 127 | 1.1 | ||
| 128 | 1.1 | ||
| 129 | 1.2 | ||
| 130 | 1.3 | ||
| 131 | 1.0 | ||
| 132 | 1.3 | ||
| 133 | 1.1 | ||
| 134 | 1.2 | ||
| 135 | 1.1 | ||
| 136 | 1.2 | ||
| 137 | 0.9 | ||
| 138 | 0.9 | ||
| 139 | 1.0 | ||
| 140 | 1.1 | ||
| 141 | 0.7 | ||
| 142 | 0.8 | ||
| 143 | 0.9 | ||
| 144 | 1.1 | ||
| 145 | 1.1 | ||
| 146 | 1.2 |
The Black-White Unemployment Rate Gap now and during the prior two recoveries– accessible version
| Months since business cycle peak | 2001-2007 | 2007-2020 | 2020-today |
| 1 | 4.6 | 4.6 | 3.0 |
| 2 | 4.1 | 4.7 | 2.9 |
| 3 | 4.1 | 4.0 | 2.5 |
| 4 | 4.3 | 4.7 | 4.5 |
| 5 | 4.0 | 4.2 | 5.2 |
| 6 | 4.8 | 4.8 | 5.2 |
| 7 | 4.6 | 4.4 | 5.4 |
| 8 | 4.8 | 4.8 | 5.1 |
| 9 | 4.9 | 5.2 | 4.9 |
| 10 | 5.0 | 5.9 | 4.4 |
| 11 | 4.9 | 5.5 | 3.9 |
| 12 | 4.9 | 5.3 | 3.5 |
| 13 | 5.5 | 5.4 | 4.3 |
| 14 | 5.5 | 5.6 | 4.2 |
| 15 | 5.1 | 6.1 | 4.4 |
| 16 | 5.4 | 5.7 | 4.0 |
| 17 | 4.6 | 6.9 | 3.9 |
| 18 | 4.7 | 6.5 | 3.4 |
| 19 | 4.6 | 6.1 | 4.2 |
| 20 | 4.7 | 6.1 | 3.6 |
| 21 | 5.6 | 5.9 | 3.9 |
| 22 | 6.2 | 6.4 | 2.8 |
| 23 | 5.3 | 6.6 | 3.9 |
| 24 | 5.6 | 6.5 | 3.5 |
| 25 | 5.2 | 7.1 | 3.3 |
| 26 | 5.6 | 7.7 | 3.0 |
| 27 | 5.5 | 7.2 | 2.7 |
| 28 | 6.0 | 7.9 | 3.0 |
| 29 | 5.5 | 7.6 | 2.5 |
| 30 | 5.5 | 6.8 | 2.9 |
| 31 | 5.8 | 6.6 | |
| 32 | 6.3 | 7.1 | |
| 33 | 5.0 | 7.3 | |
| 34 | 5.1 | 7.4 | |
| 35 | 5.4 | 7.0 | |
| 36 | 4.8 | 7.3 | |
| 37 | 5.2 | 7.0 | |
| 38 | 4.8 | 7.7 | |
| 39 | 5.2 | 7.4 | |
| 40 | 5.2 | 7.8 | |
| 41 | 6.3 | 8.4 | |
| 42 | 5.8 | 8.4 | |
| 43 | 5.7 | 8.1 | |
| 44 | 6.2 | 7.9 | |
| 45 | 6.1 | 8.5 | |
| 46 | 6.2 | 8.0 | |
| 47 | 6.1 | 6.7 | |
| 48 | 6.3 | 7.9 | |
| 49 | 6.0 | 7.9 | |
| 50 | 5.9 | 6.2 | |
| 51 | 5.7 | 6.6 | |
| 52 | 5.9 | 6.7 | |
| 53 | 5.0 | 5.9 | |
| 54 | 5.5 | 6.1 | |
| 55 | 5.0 | 7.2 | |
| 56 | 4.7 | 6.9 | |
| 57 | 6.3 | 6.6 | |
| 58 | 5.0 | 6.6 | |
| 59 | 4.8 | 7.2 | |
| 60 | 5.4 | 6.5 | |
| 61 | 5.5 | 7.1 | |
| 62 | 5.3 | 6.6 | |
| 63 | 4.6 | 7.0 | |
| 64 | 4.8 | 6.3 | |
| 65 | 5.4 | 6.6 | |
| 66 | 4.7 | 6.7 | |
| 67 | 5.1 | 7.6 | |
| 68 | 4.5 | 6.1 | |
| 69 | 4.5 | 6.4 | |
| 70 | 4.4 | 6.7 | |
| 71 | 3.7 | 6.5 | |
| 72 | 3.9 | 6.2 | |
| 73 | 4.6 | 6.0 | |
| 74 | 4.3 | 6.4 | |
| 75 | 4.4 | 6.0 | |
| 76 | 4.4 | 6.3 | |
| 77 | 3.9 | 6.3 | |
| 78 | 3.4 | 6.0 | |
| 79 | 3.8 | 5.7 | |
| 80 | 4.4 | 6.3 | |
| 81 | 4.3 | 6.1 | |
| 82 | 4.6 | 5.9 | |
| 83 | 5.7 | ||
| 84 | 5.9 | ||
| 85 | 5.9 | ||
| 86 | 5.4 | ||
| 87 | 5.4 | ||
| 88 | 5.1 | ||
| 89 | 5.0 | ||
| 90 | 5.5 | ||
| 91 | 5.1 | ||
| 92 | 4.6 | ||
| 93 | 5.0 | ||
| 94 | 4.9 | ||
| 95 | 4.6 | ||
| 96 | 5.0 | ||
| 97 | 4.1 | ||
| 98 | 4.3 | ||
| 99 | 4.4 | ||
| 100 | 4.6 | ||
| 101 | 4.4 | ||
| 102 | 4.0 | ||
| 103 | 4.4 | ||
| 104 | 4.0 | ||
| 105 | 3.6 | ||
| 106 | 4.1 | ||
| 107 | 4.1 | ||
| 108 | 4.0 | ||
| 109 | 3.8 | ||
| 110 | 3.3 | ||
| 111 | 4.0 | ||
| 112 | 4.0 | ||
| 113 | 3.8 | ||
| 114 | 4.0 | ||
| 115 | 3.1 | ||
| 116 | 3.5 | ||
| 117 | 3.8 | ||
| 118 | 3.5 | ||
| 119 | 4.0 | ||
| 120 | 3.8 | ||
| 121 | 3.0 | ||
| 122 | 4.0 | ||
| 123 | 3.2 | ||
| 124 | 3.2 | ||
| 125 | 2.7 | ||
| 126 | 2.4 | ||
| 127 | 2.9 | ||
| 128 | 3.1 | ||
| 129 | 2.8 | ||
| 130 | 2.8 | ||
| 131 | 3.1 | ||
| 132 | 2.7 | ||
| 133 | 3.3 | ||
| 134 | 3.5 | ||
| 135 | 3.9 | ||
| 136 | 3.2 | ||
| 137 | 3.3 | ||
| 138 | 2.8 | ||
| 139 | 2.5 | ||
| 140 | 2.5 | ||
| 141 | 1.9 | ||
| 142 | 2.2 | ||
| 143 | 2.3 | ||
| 144 | 2.4 | ||
| 145 | 2.8 | ||
| 146 | 3.2 |
| Month and Year | Unemployment Rate: White: 16 Years + (SA, %) | Unemployment Rate: Black: 16 Years + (SA, %) | Unemployment Rate: Hispanic: 16 Years + (SA, %) |
| Jan:2000 | 8.1 | 3.7 | 4.8 |
| Feb:2000 | 8.5 | 3.9 | 5.3 |
| Mar:2000 | 8.3 | 4.0 | 5.0 |
| Apr:2000 | 8.0 | 4.0 | 5.3 |
| May:2000 | 8.5 | 4.2 | 6.4 |
| Jun:2000 | 8.4 | 4.2 | 6.2 |
| Jul:2000 | 8.9 | 4.4 | 6.2 |
| Aug:2000 | 9.5 | 4.5 | 6.7 |
| Sep:2000 | 10.5 | 4.8 | 6.5 |
| Oct:2000 | 10.5 | 5.0 | 7.3 |
| Nov:2000 | 11.9 | 5.3 | 7.4 |
| Dec:2000 | 12.0 | 5.7 | 7.9 |
| Jan:2001 | 12.5 | 6.0 | 8.0 |
| Feb:2001 | 13.9 | 6.6 | 8.9 |
| Mar:2001 | 14.4 | 7.1 | 9.7 |
| Apr:2001 | 15.2 | 7.7 | 10.9 |
| May:2001 | 15.6 | 8.3 | 11.4 |
| Jun:2001 | 17.2 | 8.6 | 10.6 |
| Jul:2001 | 16.6 | 9.0 | 11.5 |
| Aug:2001 | 16.3 | 9.1 | 11.2 |
| Sep:2001 | 16.1 | 9.0 | 12.0 |
| Oct:2001 | 16.6 | 9.2 | 12.8 |
| Nov:2001 | 16.2 | 9.4 | 12.3 |
| Dec:2001 | 17.3 | 9.6 | 12.3 |
| Jan:2002 | 17.0 | 9.6 | 11.8 |
| Feb:2002 | 16.7 | 9.3 | 12.2 |
| Mar:2002 | 17.9 | 9.3 | 12.4 |
| Apr:2002 | 18.1 | 9.3 | 12.3 |
| May:2002 | 19.3 | 9.1 | 12.1 |
| Jun:2002 | 17.9 | 9.4 | 11.7 |
| Jul:2002 | 16.8 | 8.7 | 11.4 |
| Aug:2002 | 17.3 | 8.7 | 11.7 |
| Sep:2002 | 16.6 | 8.7 | 10.9 |
| Oct:2002 | 16.7 | 8.8 | 10.9 |
| Nov:2002 | 17.2 | 8.7 | 11.6 |
| Dec:2002 | 16.2 | 8.6 | 11.2 |
| Jan:2003 | 16.9 | 9.1 | 12.1 |
| Feb:2003 | 16.4 | 8.5 | 12.3 |
| Mar:2003 | 16.8 | 8.0 | 11.6 |
| Apr:2003 | 16.7 | 8.0 | 11.0 |
| May:2003 | 17.2 | 7.9 | 10.6 |
| Jun:2003 | 17.5 | 8.0 | 10.8 |
| Jul:2003 | 17.3 | 7.8 | 10.4 |
| Aug:2003 | 17.0 | 7.9 | 10.1 |
| Sep:2003 | 16.9 | 7.8 | 9.9 |
| Oct:2003 | 17.5 | 7.6 | 9.4 |
| Nov:2003 | 16.3 | 7.6 | 10.0 |
| Dec:2003 | 15.8 | 7.7 | 10.2 |
| Jan:2004 | 16.6 | 7.2 | 9.9 |
| Feb:2004 | 15.1 | 7.2 | 10.0 |
| Mar:2004 | 12.8 | 7.0 | 9.4 |
| Apr:2004 | 14.4 | 6.9 | 9.4 |
| May:2004 | 14.1 | 6.8 | 9.3 |
| Jun:2004 | 14.0 | 6.8 | 9.0 |
| Jul:2004 | 14.1 | 6.9 | 9.9 |
| Aug:2004 | 14.3 | 7.0 | 9.8 |
| Sep:2004 | 15.1 | 6.8 | 8.8 |
| Oct:2004 | 13.8 | 6.7 | 8.6 |
| Nov:2004 | 14.0 | 6.6 | 8.1 |
| Dec:2004 | 13.9 | 6.5 | 8.7 |
| Jan:2005 | 13.2 | 6.4 | 7.9 |
| Feb:2005 | 13.7 | 6.3 | 8.0 |
| Mar:2005 | 13.3 | 6.7 | 8.5 |
| Apr:2005 | 12.6 | 6.3 | 8.1 |
| May:2005 | 12.8 | 6.1 | 7.8 |
| Jun:2005 | 13.1 | 6.4 | 8.1 |
| Jul:2005 | 13.5 | 6.4 | 7.6 |
| Aug:2005 | 13.2 | 6.2 | 7.9 |
| Sep:2005 | 12.6 | 6.3 | 8.2 |
| Oct:2005 | 13.4 | 6.2 | 8.2 |
| Nov:2005 | 14.1 | 6.1 | 8.0 |
| Dec:2005 | 12.7 | 6.1 | 8.2 |
| Jan:2006 | 12.0 | 5.9 | 7.7 |
| Feb:2006 | 11.4 | 5.6 | 7.1 |
| Mar:2006 | 12.0 | 5.4 | 7.0 |
| Apr:2006 | 12.6 | 5.5 | 6.4 |
| May:2006 | 11.9 | 5.2 | 6.4 |
| Jun:2006 | 11.1 | 5.0 | 6.1 |
| Jul:2006 | 11.7 | 5.0 | 6.6 |
| Aug:2006 | 11.0 | 4.9 | 6.7 |
| Sep:2006 | 11.6 | 4.7 | 6.5 |
| Oct:2006 | 10.8 | 4.9 | 6.2 |
| Nov:2006 | 11.0 | 4.4 | 5.2 |
| Dec:2006 | 10.3 | 4.2 | 5.4 |
| Jan:2007 | 11.0 | 4.6 | 5.9 |
| Feb:2007 | 10.9 | 4.3 | 5.3 |
| Mar:2007 | 10.5 | 4.5 | 5.8 |
| Apr:2007 | 10.0 | 4.5 | 6.0 |
| May:2007 | 9.9 | 4.4 | 5.7 |
| Jun:2007 | 9.2 | 4.4 | 5.9 |
| Jul:2007 | 10.6 | 4.3 | 6.1 |
| Aug:2007 | 9.5 | 4.2 | 6.1 |
| Sep:2007 | 8.9 | 4.2 | 6.1 |
| Oct:2007 | 9.2 | 4.1 | 5.2 |
| Nov:2007 | 8.9 | 4.1 | 5.3 |
| Dec:2007 | 8.8 | 4.1 | 5.0 |
| Jan:2008 | 10.0 | 4.1 | 5.4 |
| Feb:2008 | 8.7 | 4.1 | 5.4 |
| Mar:2008 | 8.2 | 3.7 | 5.0 |
| Apr:2008 | 8.5 | 3.8 | 4.8 |
| May:2008 | 8.5 | 3.9 | 4.9 |
| Jun:2008 | 9.2 | 4.0 | 5.0 |
| Jul:2008 | 7.6 | 3.9 | 4.7 |
| Aug:2008 | 8.2 | 4.0 | 4.8 |
| Sep:2008 | 8.2 | 4.1 | 4.8 |
| Oct:2008 | 7.5 | 4.1 | 4.7 |
| Nov:2008 | 8.4 | 4.2 | 5.1 |
| Dec:2008 | 8.7 | 4.1 | 4.9 |
| Jan:2009 | 7.9 | 3.9 | 5.0 |
| Feb:2009 | 7.8 | 4.0 | 4.7 |
| Mar:2009 | 7.3 | 3.9 | 4.6 |
| Apr:2009 | 7.9 | 3.7 | 4.6 |
| May:2009 | 8.1 | 3.5 | 4.4 |
| Jun:2009 | 6.9 | 3.5 | 4.3 |
| Jul:2009 | 6.6 | 3.5 | 4.4 |
| Aug:2009 | 6.2 | 3.6 | 4.0 |
| Sep:2009 | 7.1 | 3.5 | 4.4 |
| Oct:2009 | 7.7 | 3.6 | 4.5 |
| Nov:2009 | 6.9 | 3.5 | 4.0 |
| Dec:2009 | 7.7 | 3.3 | 4.0 |
| Jan:2010 | 7.6 | 3.3 | 4.0 |
| Feb:2010 | 6.7 | 3.4 | 4.0 |
| Mar:2010 | 7.4 | 3.2 | 4.1 |
| Apr:2010 | 5.9 | 3.3 | 3.9 |
| May:2010 | 5.8 | 3.2 | 4.1 |
| Jun:2010 | 6.1 | 3.4 | 3.9 |
| Jul:2010 | 6.1 | 3.2 | 3.9 |
| Aug:2010 | 6.3 | 3.3 | 3.9 |
| Sep:2010 | 6.1 | 3.0 | 3.4 |
| Oct:2010 | 5.9 | 3.1 | 3.8 |
| Nov:2010 | 6.0 | 3.1 | 3.9 |
| Dec:2010 | 6.7 | 3.1 | 3.9 |
| Jan:2011 | 6.1 | 3.0 | 3.6 |
| Feb:2011 | 6.4 | 3.2 | 3.6 |
| Mar:2011 | 7.3 | 3.2 | 3.8 |
| Apr:2011 | 7.3 | 2.8 | 3.5 |
| May:2011 | 6.6 | 3.1 | 3.8 |
| Jun:2011 | 6.6 | 2.9 | 3.6 |
| Jul:2011 | 5.9 | 3.0 | 3.5 |
| Aug:2011 | 5.5 | 3.0 | 3.5 |
| Sep:2011 | 5.6 | 3.0 | 3.9 |
| Oct:2011 | 5.8 | 3.1 | 3.4 |
| Nov:2011 | 5.4 | 2.9 | 3.2 |
| Dec:2011 | 5.2 | 3.0 | 3.4 |
| Jan:2012 | 5.1 | 3.0 | 3.2 |
| Feb:2012 | 5.9 | 2.8 | 3.2 |
| Mar:2012 | 5.9 | 2.8 | 3.3 |
| Apr:2012 | 6.1 | 2.8 | 3.1 |
| May:2012 | 7.0 | 3.7 | 5.0 |
| Jun:2012 | 16.0 | 12.3 | 16.5 |
| Jul:2012 | 15.3 | 10.7 | 15.2 |
| Aug:2012 | 16.0 | 8.9 | 12.8 |
| Sep:2012 | 15.0 | 8.3 | 11.3 |
| Oct:2012 | 13.2 | 6.9 | 9.9 |
| Nov:2012 | 12.8 | 6.5 | 8.9 |
| Dec:2012 | 11.5 | 5.9 | 8.3 |
| Jan:2013 | 11.5 | 5.9 | 8.0 |
| Feb:2013 | 10.5 | 5.8 | 8.9 |
| Mar:2013 | 9.4 | 5.5 | 7.6 |
| Apr:2013 | 10.1 | 5.3 | 7.5 |
| May:2013 | 9.7 | 5.2 | 7.2 |
| Jun:2013 | 10.2 | 5.3 | 7.1 |
| Jul:2013 | 9.7 | 5.1 | 6.4 |
| Aug:2013 | 9.9 | 5.2 | 6.3 |
| Sep:2013 | 8.5 | 4.8 | 5.9 |
| Oct:2013 | 9.0 | 4.4 | 5.6 |
| Nov:2013 | 7.9 | 4.2 | 5.6 |
| Dec:2013 | 8.2 | 3.6 | 5.0 |
| Jan:2014 | 7.2 | 3.3 | 4.5 |
| Feb:2014 | 7.0 | 3.0 | 4.2 |
| Mar:2014 | 7.1 | 3.2 | 4.3 |
| Apr:2014 | 6.4 | 3.0 | 3.7 |
| May:2014 | 5.6 | 3.1 | 3.8 |
| Jun:2014 | 6.1 | 3.1 | 3.7 |
| Jul:2014 | 5.7 | 3.1 | 3.4 |
| Aug:2014 | 5.3 | 3.1 | 3.4 |
| Sep:2014 | 5.1 | 11.0 | 6.8 |
| Oct:2014 | 4.9 | 10.6 | 6.8 |
| Nov:2014 | 5.0 | 10.9 | 6.6 |
| Dec:2014 | 4.7 | 10.6 | 6.4 |
| Jan:2015 | 4.9 | 10.3 | 6.7 |
| Feb:2015 | 4.7 | 10.1 | 6.8 |
| Mar:2015 | 4.8 | 9.9 | 6.8 |
| Apr:2015 | 4.7 | 9.7 | 6.8 |
| May:2015 | 4.8 | 10.3 | 6.8 |
| Jun:2015 | 4.6 | 9.7 | 6.7 |
| Jul:2015 | 4.5 | 9.1 | 6.9 |
| Aug:2015 | 4.4 | 9.4 | 6.6 |
| Sep:2015 | 4.4 | 9.3 | 6.2 |
| Oct:2015 | 4.4 | 9.0 | 6.3 |
| Nov:2015 | 4.4 | 9.4 | 6.4 |
| Dec:2015 | 4.4 | 8.5 | 6.2 |
| Jan:2016 | 4.2 | 8.5 | 5.9 |
| Feb:2016 | 4.2 | 8.6 | 5.5 |
| Mar:2016 | 4.3 | 8.9 | 5.6 |
| Apr:2016 | 4.4 | 8.8 | 6.2 |
| May:2016 | 4.2 | 8.2 | 5.7 |
| Jun:2016 | 4.3 | 8.7 | 6.0 |
| Jul:2016 | 4.2 | 8.2 | 5.4 |
| Aug:2016 | 4.4 | 8.0 | 5.6 |
| Sep:2016 | 4.4 | 8.5 | 6.2 |
| Oct:2016 | 4.4 | 8.5 | 5.7 |
| Nov:2016 | 4.2 | 8.2 | 5.6 |
| Dec:2016 | 4.2 | 8.0 | 5.8 |
| Jan:2017 | 4.2 | 7.5 | 5.8 |
| Feb:2017 | 4.0 | 8.0 | 5.6 |
| Mar:2017 | 3.8 | 7.8 | 5.0 |
| Apr:2017 | 3.9 | 7.7 | 5.2 |
| May:2017 | 3.7 | 7.7 | 5.2 |
| Jun:2017 | 3.8 | 6.9 | 5.0 |
| Jul:2017 | 3.8 | 7.3 | 5.1 |
| Aug:2017 | 3.9 | 7.7 | 5.1 |
| Sep:2017 | 3.7 | 7.2 | 5.1 |
| Oct:2017 | 3.6 | 7.6 | 5.0 |
| Nov:2017 | 3.7 | 7.5 | 4.9 |
| Dec:2017 | 3.7 | 6.7 | 5.0 |
| Jan:2018 | 3.5 | 7.5 | 4.9 |
| Feb:2018 | 3.6 | 6.8 | 4.9 |
| Mar:2018 | 3.5 | 6.7 | 4.9 |
| Apr:2018 | 3.6 | 6.3 | 4.7 |
| May:2018 | 3.5 | 5.9 | 4.8 |
| Jun:2018 | 3.5 | 6.4 | 4.6 |
| Jul:2018 | 3.4 | 6.5 | 4.5 |
| Aug:2018 | 3.5 | 6.3 | 4.7 |
| Sep:2018 | 3.3 | 6.1 | 4.6 |
| Oct:2018 | 3.4 | 6.5 | 4.4 |
| Nov:2018 | 3.4 | 6.1 | 4.7 |
| Dec:2018 | 3.4 | 6.7 | 4.5 |
| Jan:2019 | 3.5 | 7.0 | 4.7 |
| Feb:2019 | 3.2 | 7.1 | 4.3 |
| Mar:2019 | 3.3 | 6.5 | 4.5 |
| Apr:2019 | 3.2 | 6.5 | 4.1 |
| May:2019 | 3.3 | 6.1 | 4.2 |
| Jun:2019 | 3.3 | 5.8 | 4.3 |
| Jul:2019 | 3.3 | 5.8 | 4.4 |
| Aug:2019 | 3.5 | 5.4 | 4.2 |
| Sep:2019 | 3.2 | 5.4 | 4.0 |
| Oct:2019 | 3.3 | 5.6 | 4.2 |
| Nov:2019 | 3.2 | 5.6 | 4.3 |
| Dec:2019 | 3.2 | 6.0 | 4.3 |
| Jan:2020 | 3.1 | 6.3 | 4.3 |
| Feb:2020 | 3.0 | 6.0 | 4.4 |
| Mar:2020 | 3.9 | 6.8 | 5.9 |
| Apr:2020 | 14.1 | 16.6 | 18.8 |
| May:2020 | 12.3 | 16.8 | 17.6 |
| Jun:2020 | 10.0 | 15.2 | 14.5 |
| Jul:2020 | 9.2 | 14.4 | 12.8 |
| Aug:2020 | 7.4 | 12.8 | 10.6 |
| Sep:2020 | 7.0 | 12.1 | 10.4 |
| Oct:2020 | 6.0 | 10.9 | 8.9 |
| Nov:2020 | 6.0 | 10.4 | 8.6 |
| Dec:2020 | 6.1 | 10.0 | 9.4 |
| Jan:2021 | 5.7 | 9.2 | 8.6 |
| Feb:2021 | 5.5 | 9.8 | 8.4 |
| Mar:2021 | 5.3 | 9.5 | 7.7 |
| Apr:2021 | 5.3 | 9.7 | 7.7 |
| May:2021 | 5.1 | 9.1 | 7.1 |
| Jun:2021 | 5.3 | 9.2 | 7.2 |
| Jul:2021 | 4.8 | 8.2 | 6.4 |
| Aug:2021 | 4.5 | 8.7 | 6.2 |
| Sep:2021 | 4.2 | 7.8 | 6.1 |
| Oct:2021 | 3.9 | 7.8 | 5.7 |
| Nov:2021 | 3.7 | 6.5 | 5.2 |
| Dec:2021 | 3.2 | 7.1 | 4.9 |
| Jan:2022 | 3.4 | 6.9 | 4.9 |
| Feb:2022 | 3.3 | 6.6 | 4.4 |
| Mar:2022 | 3.2 | 6.2 | 4.2 |
| Apr:2022 | 3.2 | 5.9 | 4.1 |
| May:2022 | 3.2 | 6.2 | 4.3 |
| Jun:2022 | 3.3 | 5.8 | 4.3 |
| Jul:2022 | 3.1 | 6.0 | 3.9 |
| Month and Year | Unemployment Rate: Black Women: 20 Years & Over (SA, %) | Unemployment Rate: White Women: 20 Years & Over (SA, %) | Unemployment Rate: 20 Years & Over, Hispanic or Latino, Women (SA, %) |
| Dec:2007 | 7.1 | 3.9 | 6.5 |
| Jan:2008 | 7.4 | 3.8 | 6.6 |
| Feb:2008 | 6.6 | 3.8 | 5.7 |
| Mar:2008 | 7.8 | 4.0 | 5.9 |
| Apr:2008 | 7.4 | 3.7 | 6.4 |
| May:2008 | 8.1 | 4.0 | 6.2 |
| Jun:2008 | 7.6 | 4.2 | 7.2 |
| Jul:2008 | 7.4 | 4.3 | 6.9 |
| Aug:2008 | 8.9 | 4.8 | 7.3 |
| Sep:2008 | 9.1 | 4.3 | 6.6 |
| Oct:2008 | 8.9 | 4.9 | 7.7 |
| Nov:2008 | 9.2 | 5.1 | 7.5 |
| Dec:2008 | 8.8 | 5.6 | 8.3 |
| Jan:2009 | 9.3 | 6.0 | 9.0 |
| Feb:2009 | 10.3 | 6.1 | 10.0 |
| Mar:2009 | 10.4 | 6.5 | 10.5 |
| Apr:2009 | 11.3 | 6.4 | 10.4 |
| May:2009 | 11.5 | 6.8 | 11.0 |
| Jun:2009 | 11.6 | 6.9 | 11.4 |
| Jul:2009 | 11.8 | 6.9 | 11.2 |
| Aug:2009 | 11.8 | 7.0 | 10.7 |
| Sep:2009 | 12.5 | 7.1 | 10.8 |
| Oct:2009 | 12.5 | 7.3 | 10.9 |
| Nov:2009 | 11.9 | 7.4 | 10.7 |
| Dec:2009 | 12.8 | 7.3 | 10.9 |
| Jan:2010 | 13.2 | 6.9 | 11.0 |
| Feb:2010 | 12.2 | 7.3 | 11.0 |
| Mar:2010 | 12.7 | 7.3 | 11.7 |
| Apr:2010 | 13.8 | 7.3 | 11.5 |
| May:2010 | 12.5 | 7.3 | 10.8 |
| Jun:2010 | 11.6 | 7.1 | 10.9 |
| Jul:2010 | 13.0 | 7.0 | 11.6 |
| Aug:2010 | 13.1 | 7.1 | 11.3 |
| Sep:2010 | 12.8 | 7.1 | 11.2 |
| Oct:2010 | 12.7 | 7.2 | 12.0 |
| Nov:2010 | 13.3 | 7.6 | 12.1 |
| Dec:2010 | 12.7 | 7.2 | 11.5 |
| Jan:2011 | 12.7 | 7.0 | 11.0 |
| Feb:2011 | 12.9 | 7.1 | 10.9 |
| Mar:2011 | 12.5 | 6.9 | 10.8 |
| Apr:2011 | 13.7 | 7.0 | 11.8 |
| May:2011 | 13.6 | 7.1 | 11.7 |
| Jun:2011 | 13.8 | 7.1 | 11.4 |
| Jul:2011 | 13.6 | 6.9 | 10.8 |
| Aug:2011 | 13.3 | 7.0 | 11.0 |
| Sep:2011 | 13.6 | 7.1 | 11.3 |
| Oct:2011 | 12.1 | 7.0 | 10.8 |
| Nov:2011 | 12.9 | 6.9 | 10.7 |
| Dec:2011 | 13.7 | 6.8 | 10.7 |
| Jan:2012 | 12.4 | 6.8 | 10.9 |
| Feb:2012 | 12.1 | 6.8 | 10.9 |
| Mar:2012 | 11.8 | 6.6 | 9.9 |
| Apr:2012 | 10.8 | 6.9 | 9.9 |
| May:2012 | 11.4 | 6.7 | 9.7 |
| Jun:2012 | 12.9 | 6.6 | 10.3 |
| Jul:2012 | 11.7 | 6.7 | 10.0 |
| Aug:2012 | 12.0 | 6.5 | 10.0 |
| Sep:2012 | 11.3 | 6.2 | 9.8 |
| Oct:2012 | 12.1 | 6.2 | 9.7 |
| Nov:2012 | 11.3 | 6.2 | 10.4 |
| Dec:2012 | 12.4 | 6.3 | 9.7 |
| Jan:2013 | 12.3 | 6.4 | 9.5 |
| Feb:2013 | 12.4 | 6.0 | 9.8 |
| Mar:2013 | 11.6 | 6.0 | 9.3 |
| Apr:2013 | 11.4 | 5.7 | 7.8 |
| May:2013 | 11.1 | 5.8 | 8.6 |
| Jun:2013 | 12.7 | 6.0 | 8.6 |
| Jul:2013 | 10.4 | 5.6 | 8.5 |
| Aug:2013 | 10.4 | 5.4 | 8.3 |
| Sep:2013 | 10.4 | 5.5 | 8.0 |
| Oct:2013 | 11.3 | 5.4 | 8.4 |
| Nov:2013 | 10.9 | 5.3 | 8.3 |
| Dec:2013 | 10.8 | 5.3 | 8.3 |
| Jan:2014 | 10.4 | 5.1 | 8.4 |
| Feb:2014 | 9.7 | 5.2 | 8.6 |
| Mar:2014 | 10.6 | 5.4 | 8.4 |
| Apr:2014 | 10.2 | 4.7 | 7.0 |
| May:2014 | 9.8 | 4.9 | 8.0 |
| Jun:2014 | 9.6 | 4.7 | 7.2 |
| Jul:2014 | 10.2 | 4.8 | 7.2 |
| Aug:2014 | 10.6 | 4.7 | 7.7 |
| Sep:2014 | 9.6 | 4.7 | 7.1 |
| Oct:2014 | 9.2 | 4.6 | 7.3 |
| Nov:2014 | 9.4 | 4.5 | 6.5 |
| Dec:2014 | 8.6 | 4.4 | 6.5 |
| Jan:2015 | 8.6 | 4.4 | 6.2 |
| Feb:2015 | 8.7 | 4.2 | 6.3 |
| Mar:2015 | 8.8 | 4.2 | 6.7 |
| Apr:2015 | 8.9 | 4.2 | 6.8 |
| May:2015 | 8.6 | 4.4 | 6.5 |
| Jun:2015 | 8.1 | 4.2 | 5.9 |
| Jul:2015 | 8.0 | 4.2 | 6.9 |
| Aug:2015 | 8.1 | 4.0 | 7.1 |
| Sep:2015 | 8.2 | 3.9 | 6.2 |
| Oct:2015 | 8.0 | 4.0 | 6.5 |
| Nov:2015 | 8.0 | 4.0 | 6.8 |
| Dec:2015 | 7.1 | 3.9 | 6.2 |
| Jan:2016 | 7.7 | 3.9 | 5.8 |
| Feb:2016 | 7.8 | 3.9 | 5.4 |
| Mar:2016 | 8.0 | 4.0 | 5.5 |
| Apr:2016 | 7.2 | 4.0 | 6.5 |
| May:2016 | 7.4 | 3.7 | 5.6 |
| Jun:2016 | 7.2 | 3.9 | 6.3 |
| Jul:2016 | 7.0 | 3.5 | 5.2 |
| Aug:2016 | 6.8 | 3.8 | 5.8 |
| Sep:2016 | 7.2 | 3.8 | 6.4 |
| Oct:2016 | 7.0 | 3.9 | 5.6 |
| Nov:2016 | 7.3 | 3.7 | 5.2 |
| Dec:2016 | 6.9 | 3.8 | 6.0 |
| Jan:2017 | 6.4 | 3.9 | 6.2 |
| Feb:2017 | 7.0 | 3.7 | 5.6 |
| Mar:2017 | 6.5 | 3.5 | 4.7 |
| Apr:2017 | 7.0 | 3.6 | 5.4 |
| May:2017 | 7.2 | 3.5 | 5.4 |
| Jun:2017 | 6.6 | 3.4 | 5.1 |
| Jul:2017 | 6.3 | 3.5 | 5.3 |
| Aug:2017 | 6.3 | 3.5 | 4.7 |
| Sep:2017 | 6.1 | 3.4 | 5.5 |
| Oct:2017 | 6.6 | 3.2 | 5.0 |
| Nov:2017 | 6.0 | 3.2 | 4.9 |
| Dec:2017 | 5.7 | 3.4 | 5.3 |
| Jan:2018 | 6.4 | 3.0 | 4.6 |
| Feb:2018 | 6.2 | 3.3 | 5.2 |
| Mar:2018 | 5.9 | 3.2 | 4.8 |
| Apr:2018 | 5.1 | 3.2 | 4.7 |
| May:2018 | 4.8 | 3.1 | 5.1 |
| Jun:2018 | 5.4 | 3.2 | 4.7 |
| Jul:2018 | 5.9 | 3.2 | 4.7 |
| Aug:2018 | 5.8 | 3.2 | 5.1 |
| Sep:2018 | 5.2 | 2.8 | 4.3 |
| Oct:2018 | 5.0 | 3.1 | 4.4 |
| Nov:2018 | 5.0 | 3.2 | 4.7 |
| Dec:2018 | 5.8 | 3.1 | 4.3 |
| Jan:2019 | 5.5 | 3.2 | 4.8 |
| Feb:2019 | 5.3 | 3.0 | 3.9 |
| Mar:2019 | 5.2 | 3.0 | 4.3 |
| Apr:2019 | 5.2 | 2.8 | 3.6 |
| May:2019 | 5.2 | 2.9 | 4.0 |
| Jun:2019 | 5.2 | 3.1 | 4.1 |
| Jul:2019 | 5.1 | 3.0 | 3.7 |
| Aug:2019 | 4.3 | 3.2 | 4.3 |
| Sep:2019 | 4.5 | 2.9 | 3.9 |
| Oct:2019 | 5.0 | 2.9 | 4.0 |
| Nov:2019 | 4.9 | 2.9 | 4.4 |
| Dec:2019 | 5.3 | 2.8 | 4.6 |
| Jan:2020 | 5.4 | 2.7 | 4.4 |
| Feb:2020 | 4.8 | 2.7 | 4.9 |
| Mar:2020 | 5.3 | 3.5 | 6.0 |
| Apr:2020 | 16.4 | 15.0 | 20.1 |
| May:2020 | 16.6 | 13.0 | 18.9 |
| Jun:2020 | 14.0 | 10.4 | 15.3 |
| Jul:2020 | 13.3 | 9.7 | 13.9 |
| Aug:2020 | 11.8 | 7.3 | 10.6 |
| Sep:2020 | 10.9 | 6.9 | 11.0 |
| Oct:2020 | 9.5 | 5.7 | 9.0 |
| Nov:2020 | 9.1 | 5.4 | 8.3 |
| Dec:2020 | 8.5 | 5.6 | 9.1 |
| Jan:2021 | 8.5 | 5.2 | 8.8 |
| Feb:2021 | 8.9 | 5.1 | 8.5 |
| Mar:2021 | 8.7 | 5.0 | 7.3 |
| Apr:2021 | 8.6 | 4.8 | 7.5 |
| May:2021 | 8.3 | 4.8 | 7.4 |
| Jun:2021 | 8.4 | 4.9 | 7.9 |
| Jul:2021 | 7.5 | 4.5 | 6.7 |
| Aug:2021 | 7.8 | 4.3 | 6.0 |
| Sep:2021 | 7.2 | 3.7 | 5.5 |
| Oct:2021 | 6.8 | 3.8 | 5.6 |
| Nov:2021 | 4.9 | 3.7 | 5.3 |
| Dec:2021 | 6.2 | 3.1 | 4.9 |
| Jan:2022 | 5.8 | 3.1 | 4.9 |
| Feb:2022 | 6.1 | 3.1 | 4.8 |
| Mar:2022 | 5.5 | 2.8 | 4.2 |
| Apr:2022 | 5.0 | 2.8 | 3.8 |
| May:2022 | 5.9 | 2.9 | 4.7 |
| Jun:2022 | 5.6 | 2.9 | 4.5 |
| Jul:2022 | 5.3 | 2.6 | 3.2 |
| Women | LFPR | Feb-20 | Apr-20 | Jun-22 | Estimated Population | Feb-20 | Apr-20 | Jul-22 |
| White | 58.2 | 55.5 | 57.1 | White | 56.6 | 47.1 | 55.8 | |
| Black | 63.9 | 59.3 | 62.0 | Black | 60.8 | 49.6 | 59.0 | |
| Hispanic | 62.1 | 56.5 | 59.6 | Hispanic | 59.1 | 45.2 | 57.7 | |
| Percent Recovered | White | 100.0 | 95.4 | 98.1 | White | 100.0 | 83.2 | 98.6 |
| Black | 100.0 | 92.8 | 97.0 | Black | 100.0 | 81.6 | 97.0 | |
| Hispanic | 100.0 | 91.0 | 96.0 | Hispanic | 100.0 | 76.5 | 97.6 |