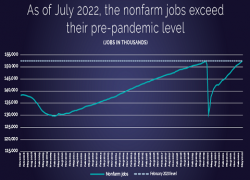
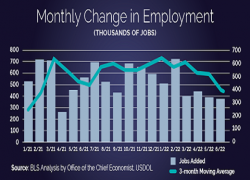
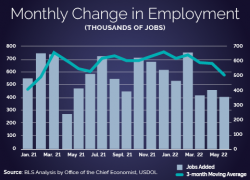
In August, the U.S. economy added 315,000 jobs, bringing the 3-month average to 378,000 jobs. The private sector added 308,000 jobs. Every sector saw job gains, with the largest gains in professional and business services (+68,000), health care (+48,000) and retail trade (+44,000). With this report, the wholesale trade sector fully recovered.
The unemployment rate rose for a positive reason – more unemployed workers began seeking jobs.
In August, the labor force participation increased to 62.4% after stagnating for several months. This increase in participation led to a slight increase in the unemployment rate, now at 3.7%. This rise was a positive sign – Americans who were not employed and not looking for work began to look for work, becoming classified as unemployed. (Unemployed persons must be actively looking for work to be counted in the primary measure of the unemployment rate.)
Notably, the prime-age (25-54 years old) employment to population ratio recovered, particularly the employment-to-population ratio for prime-age women. And prime-age women’s labor force participation rate now exceeds its February 2020 point. This is one month of data that we hope will become a trend.
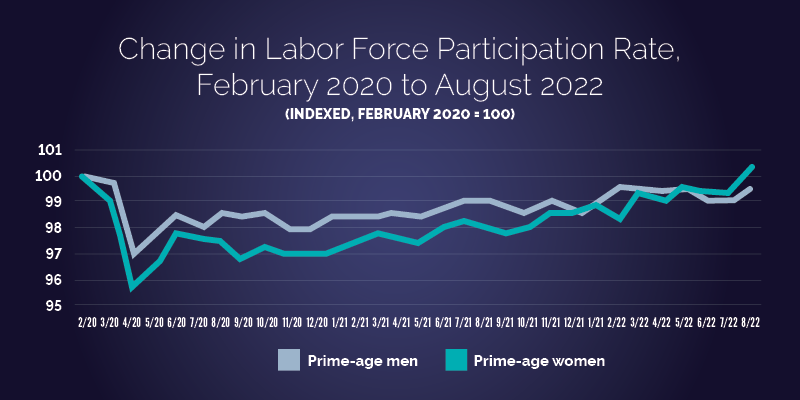
Change in Labor Force Participation Rate, February 2020 to August 2022 - accessible version
Racial unemployment gaps persist
Disaggregating labor market data by race and gender is important for getting a fuller picture of labor market outcomes and for advancing policy designed to uplift all of America. The Department continues this commitment with the Bureau of Labor Statistic’s publication of two new monthly data series: labor market indicators for Americans of two or more races and indicators for Native Hawaiian and Other Pacific Islanders. (Learn more here.) Additionally, the gaps within unemployment rates by race and gender persist, including in the August jobs data, even as workers of all races get jobs and labor force participation improves.
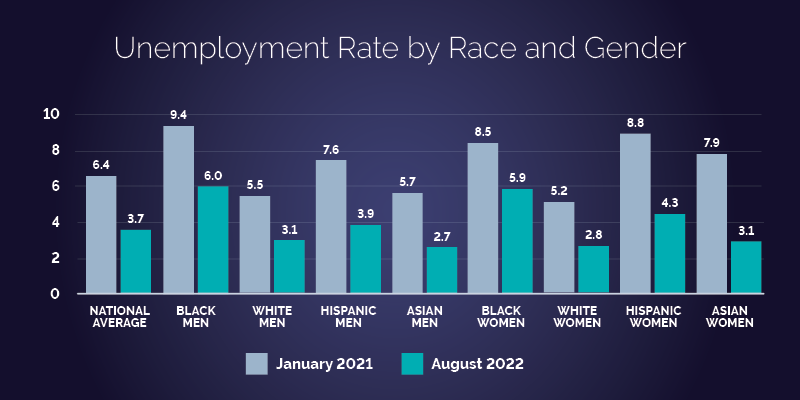
Unemployment Rate by Race and Gender chart - accessible version
Labor market outcomes for Black and brown workers are correlated with the business cycle, though not completely determined by them. These inequities underscore the importance of investing in economic growth that is shared, including through the investments made in the Bipartisan Infrastructure Law, the CHIPS and Science Act and the Inflation Reduction Act. At the Department of Labor, an equitable recovery and an equitable labor market are top priorities, from enforcing the federal laws targeting unfair and discriminatory practices to promoting pathways to good-paying jobs for everyone through the Good Jobs Initiative.
Joelle Gamble is the chief economist for the U.S. Department of Labor.
| Date | Men | Women | Prime-age men | Prime-age women |
|---|---|---|---|---|
| February 2020 | 100 | 100 | 100 | 100 |
| March 2020 | 98.98989899 | 98.61830743 | 99.77578475 | 98.95968791 |
| April 2020 | 95.38239538 | 93.95509499 | 96.86098655 | 95.5786736 |
| May 2020 | 96.24819625 | 95.16407599 | 97.75784753 | 96.6189857 |
| June 2020 | 97.11399711 | 97.06390328 | 98.43049327 | 97.91937581 |
| July 2020 | 96.82539683 | 97.23661485 | 98.0941704 | 97.65929779 |
| August 2020 | 97.54689755 | 96.71848014 | 98.5426009 | 97.39921977 |
| September 2020 | 97.4025974 | 96.20034542 | 98.31838565 | 96.74902471 |
| October 2020 | 97.69119769 | 96.89119171 | 98.43049327 | 97.26918075 |
| November 2020 | 97.25829726 | 96.71848014 | 97.86995516 | 97.00910273 |
| December 2020 | 97.25829726 | 96.54576857 | 97.98206278 | 97.13914174 |
| January 2021 | 97.4025974 | 95.85492228 | 98.20627803 | 97.13914174 |
| February 2021 | 97.25829726 | 96.54576857 | 98.20627803 | 97.39921977 |
| March 2021 | 97.11399711 | 97.063903 | 98.20627803 | 97.7893368 |
| April 2021 | 97.54689755 | 96.37305699 | 98.5426009 | 97.65929779 |
| May 2021 | 97.4025974 | 96.37305699 | 98.5426009 | 97.52925878 |
| June 2021 | 97.54689755 | 97.23661485 | 98.76681614 | 98.04941482 |
| July 2021 | 97.54689755 | 97.40932642 | 98.99103139 | 98.30949285 |
| August 2021 | 97.69119769 | 96.89119171 | 98.99103139 | 98.04941482 |
| September 2021 | 97.69119769 | 96.71848014 | 98.87892377 | 97.91937581 |
| October 2021 | 97.69119769 | 97.23661485 | 98.76681614 | 98.04941482 |
| November 2021 | 97.83549784 | 97.40932642 | 98.87892377 | 98.43953186 |
| December 2021 | 97.69119769 | 97.40932642 | 98.65470852 | 98.69960988 |
| January 2022 | 97.97979798 | 97.75474957 | 98.87892377 | 98.82964889 |
| February 2022 | 98.55699856 | 97.75474957 | 99.55156951 | 98.56957087 |
| March 2022 | 98.55699856 | 98.27288428 | 99.43946188 | 99.47984395 |
| April 2022 | 98.12409812 | 97.582038 | 99.43946188 | 99.08972692 |
| May 2022 | 98.12409812 | 98.10017271 | 99.43946188 | 99.60988296 |
| June 2022 | 97.83549784 | 98.44559585 | 99.10313901 | 99.34980494 |
| July 2022 | 97.54689755 | 98.61830743 | 99.10313901 | 99.34980494 |
| August 2022 | 97.83549784 | 98.61830743 | 99.32735426 | 100.390117 |
Unemployment Rate by Race and Gender, accessible version
| National Average | Black men | Hispanic men | Asian men | Black women | White women | Hispanic women | Asian women | ||
|---|---|---|---|---|---|---|---|---|---|
| January 2021 | 6.4 | 9.4 | 5.5 | 7.6 | 5.7 | 8.5 | 5.2 | 8.8 | 7.9 |
| August 2022 | 3.7 | 6 | 3.1 | 3.9 | 2.7 | 5.9 | 2.8 | 4.3 | 3.1 |