
Researchers in our Office of Disability Employment Policy recently analyzed workforce data on American Indian or Alaska Native representation in various industries and occupations. This is the latest in an ongoing series of data snapshots about different subgroups of disabled people. Previous snapshots explored Hispanic workers with disabilities, Asian Americans and Pacific Islanders with disabilities, Black workers with disabilities and Women with disabilities.
Unless otherwise noted, the data below reflect the authors’ calculations using the Current Population Survey 2021 annual averages and include civilian, non-institutionalized American Indian or Alaska Native adults ages 16-64. We consider a person answering “yes” to any one of the six difficulty questions (hearing difficulty, vision difficulty, cognitive difficulty, ambulatory difficulty, self-care difficulty and independent living difficulty) to have a disability.
Over 500,000 working-age American Indian or Alaska Native adults in the United States have a disability.
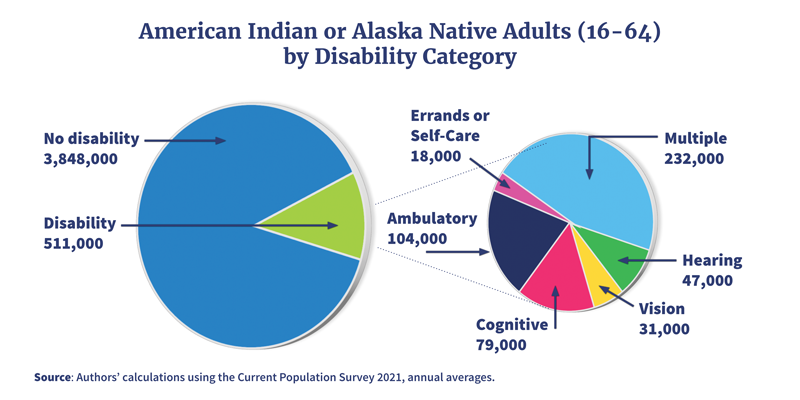
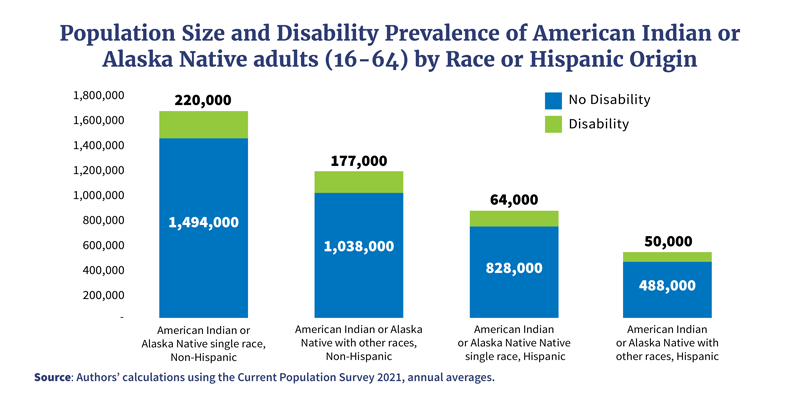
57% of working-age American Indian or Alaska Native adults with disabilities are multiracial and/or of Hispanic origin.
American Indian or Alaska Native women and men with disabilities (age 16+) are present in all stages of working life, with the highest numbers among those age 55+.
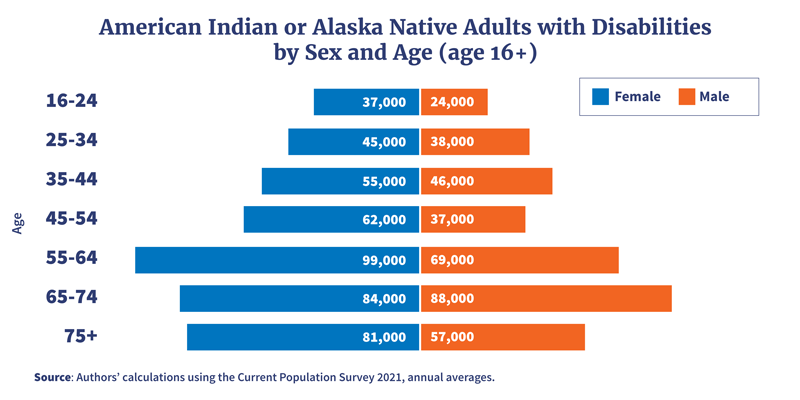
American Indian or Alaska Native Adults with Disabilities by Sex and Age – plain text
Approximately 237,000 American Indian or Alaska Native Adults with Disabilities (age 16+) are currently working or want to work.
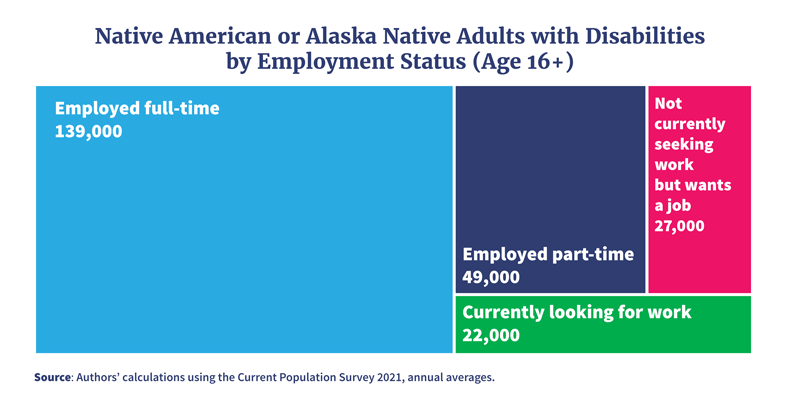
Includes civilian, non-institutionalized, American Indian or Alaska Native adults with disabilities ages 16+.
166,000 disabled American Indian or Alaska Native workers (age 16+) hold wage and salary jobs in the public, for-profit or non-profit sectors, while 22,000 are self-employed.
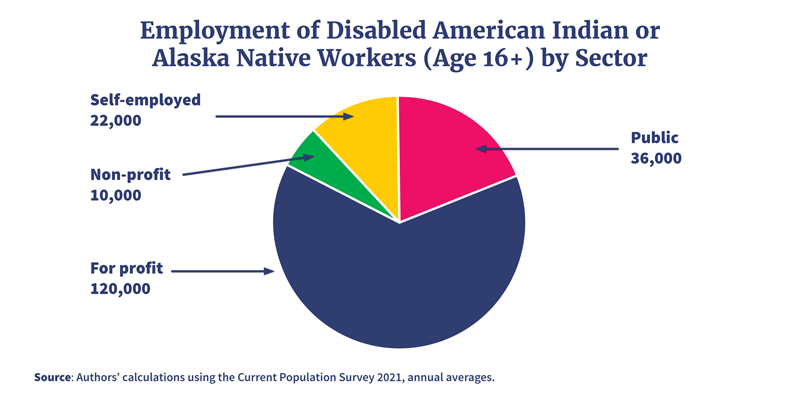
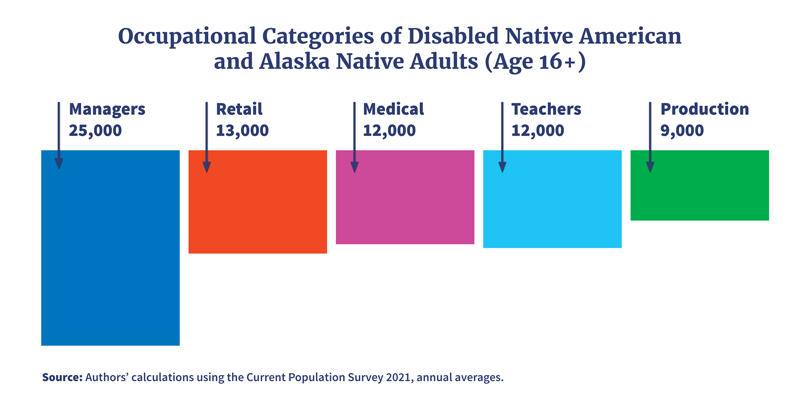
American Indian or Alaska Native adults with disabilities (age 16+) work in a range of industries, with the largest numbers in education and healthcare. They also hold a variety of occupations, including managerial positions, medical professions, retail, production and teaching.
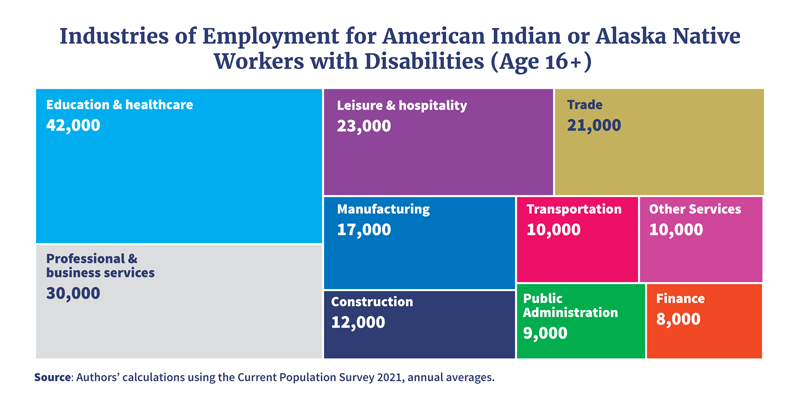
Includes civilian, non-institutionalized, American Indian or Alaska Native workers with disabilities ages 16+.
The Office of Disability Employment Policy promotes policies and coordinates with employers and all levels of government to increase workplace success for people with disabilities. ODEP's mission is to develop and influence policies and practices that increase the number and quality of employment opportunities for people with disabilities. For more information please visit: dol.gov/odep.
| Age Range | Female | Male |
|---|---|---|
|
16-24 |
37,000 |
24,000 |
|
25-34 |
45,000 |
38,000 |
|
35-44 |
55,000 |
46,000 |
|
45-54 |
62,000 |
37,000 |
|
55-64 |
99,000 |
69,000 |
|
65-74 |
84,000 |
88,000 |
|
75+ |
81,000 |
57,000 |