Small businesses are the engine of the American economy, employing just under half of all U.S. workers and comprising more than 99% of businesses. Owning a small business that employs others or being self-employed is an important avenue to economic empowerment for many people. This is particularly true for people with disabilities who may benefit from greater access, freedom and flexibility at work.
To help inform the development of policies, initiatives and support services that promote employment and entrepreneurship among disabled people in small business, ODEP continually seeks to collect and improve national data on the topic. To that end, ODEP recently collaborated with the U.S. Census Bureau to include a new question about business ownership and disability in one key source of data, the Annual Business Survey (ABS). The question is based on the definition of disability under the Americans with Disabilities Act: “Does the owner have a physical or mental impairment that substantially limits one or more of his/her major life activities? For this survey, major life activities can include both those in everyday and professional life.”
In this blog post and the previous post in the series, we compare the new ABS data with existing statistics from the Current Population Survey (CPS), the primary source of labor-force statistics in the United States. The CPS, sponsored jointly by the U.S. Census Bureau and the U.S. Bureau of Labor Statistics, includes a set of six questions to identify people with disabilities. Beyond the CPS and ABS, additional measures of business ownership among people with disabilities are scarce.
New Findings
In our previous blog post, we presented figures reflecting data on business owners with disabilities from the 2022 ABS, which captured respondents’ 2021 experiences, and compared these new data with information from the CPS on self-employed people and wage-and-salary employees. We described differences in disability rates among business owners by gender, race/ethnicity and veteran status.
In this post, we continue our analysis of disabled business owners and self-employed workers to investigate differences by industry and age and trace changes over time.
How does the rate of disability among business owners differ across industries?
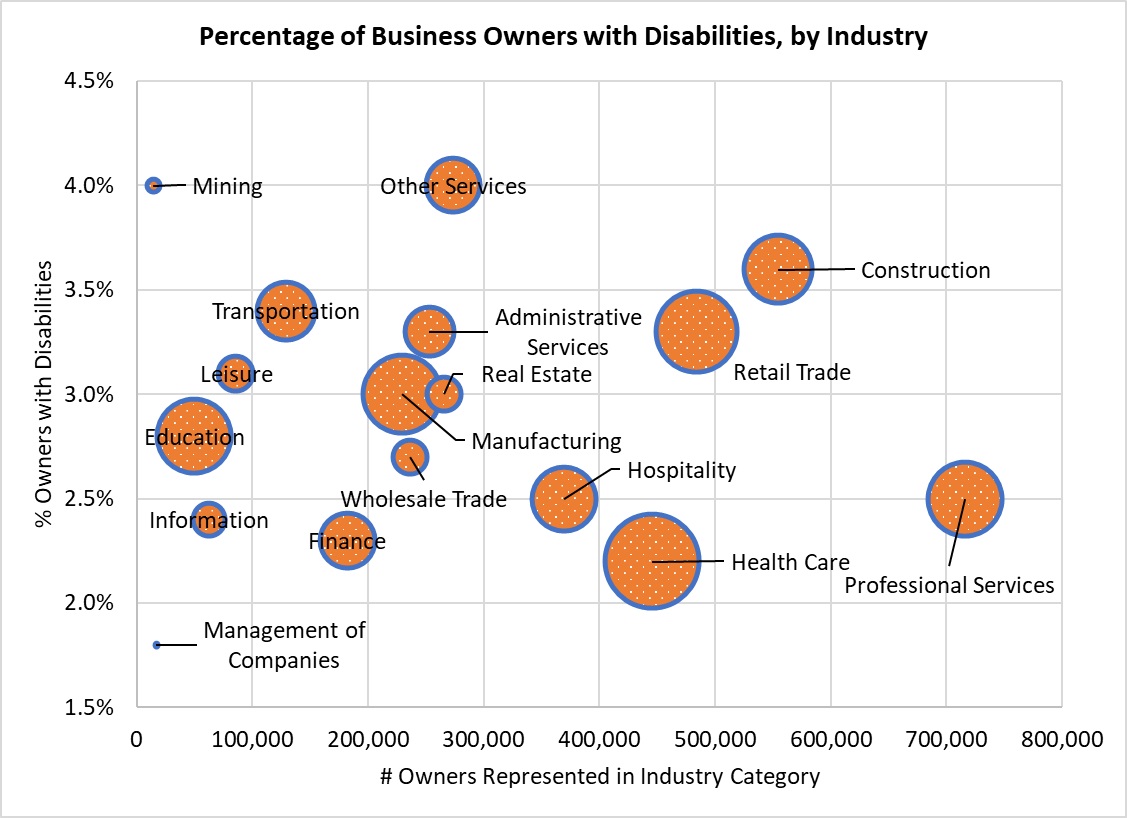

• Disability prevalence among business owners, by industry, ranges from a high of 4% in mining and the “other services” industries to a low of 1.8% in the “management of companies” industry.
• The size of each industry included in the survey varies greatly in terms of the number of employees and the number of business owners represented in the surveyed sample.
- The professional services industry has the highest number of business owners at 716,000, followed by the construction industry at 555,000, while the lowest numbers are found in management of companies with 17,000, and mining with 15,000.
- The number of workers in each industry, represented in the chart by the size of each bubble, ranges from 101,000 in management of companies and 601,000 in mining to 16.3 million in retail trade and 21.5 million in health care.
How does the rate of disability among wage-and-salary employees and self-employed workers differ across industries?
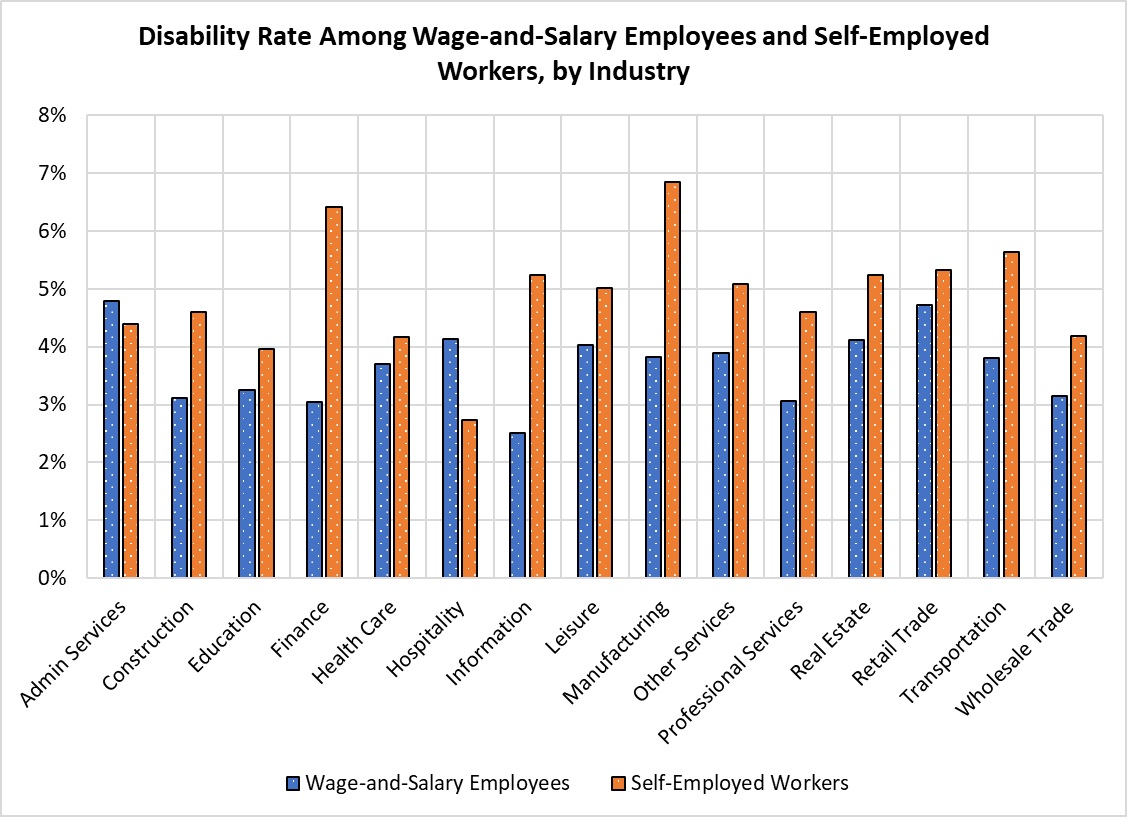

- There is a considerable range in disability rates among wage-and-salary employees across industries, from 2.5% in the information industry to 4.8% in administrative services. Among self-employed workers, disability rates range from 2.7% in hospitality to 6.8% in manufacturing.
- Disability rates among self-employed workers are consistently higher than those among wage-and-salary employees in the following industries: construction, finance, information, manufacturing, other services, professional services, real estate and transportation. The industry with the largest difference is finance, with disability rates of 6.4% among self-employed workers and 3.1% among wage-and-salary workers.
- Hospitality is the only industry in which the lower disability rate among self-employed people, relative to wage-and-salary workers, is statistically significant.
- There are no significant differences in disability rates between wage-and-salary and self-employed workers in the following industries: administrative services, education, health care, leisure, retail and wholesale trade.
How have disability rates among self-employed workers changed over time?
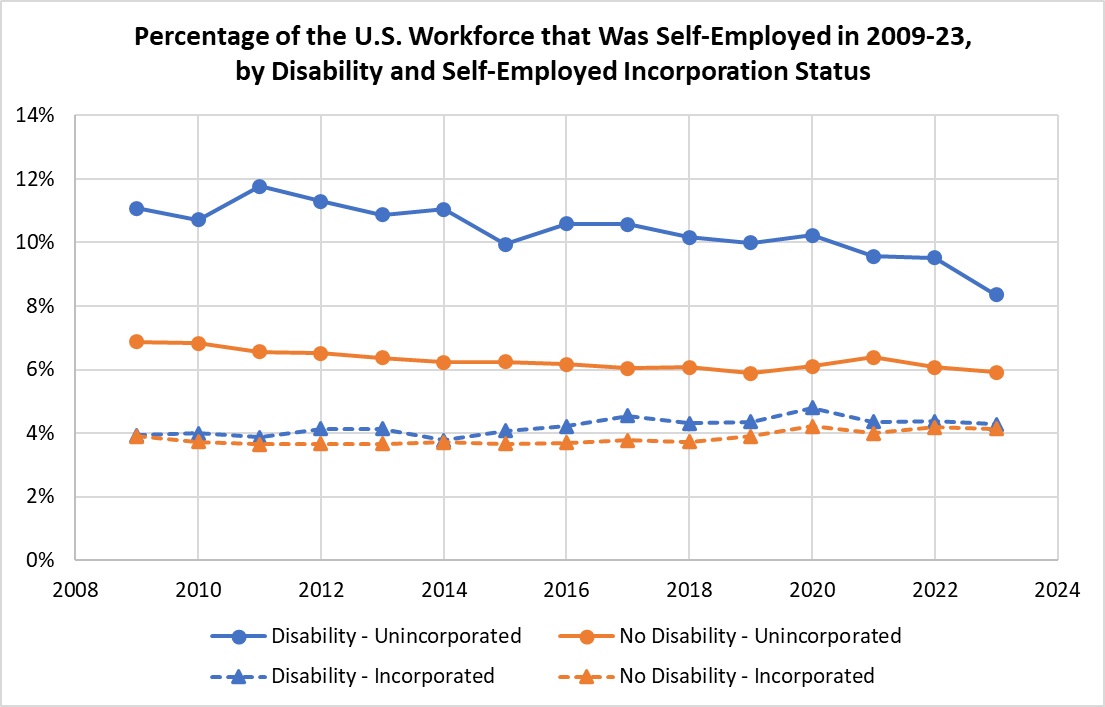
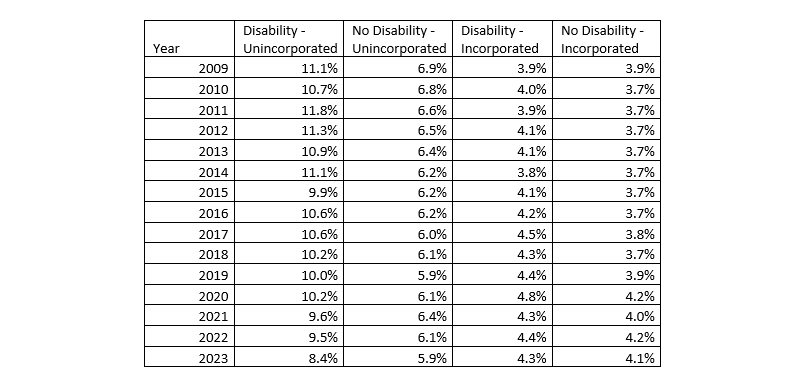
• Between 2009 and 2023, people with and without disabilities were equally likely to be self-employed incorporated workers (i.e., with a legally incorporated business, often with employees of their own).
• By contrast, people with disabilities were significantly more likely than people without disabilities to be self-employed unincorporated workers (e.g., freelancers), though that gap has narrowed in recent years. In 2011, for example, people with disabilities were nearly twice as likely as those without disabilities to be self-employed unincorporated (11.8% vs. 6.6%, respectively), but by 2023 the gap had narrowed to 8.4% for disabled people and 5.9% for nondisabled people.
• Between 2009 and 2023, the proportion of self-employed incorporated workers remained relatively stable among both people with and without disabilities; during the same time, there were slight declines in the proportion who were self-employed unincorporated.
What are the differences in disability rates among self-employed workers by age? How have these differences changed over time?
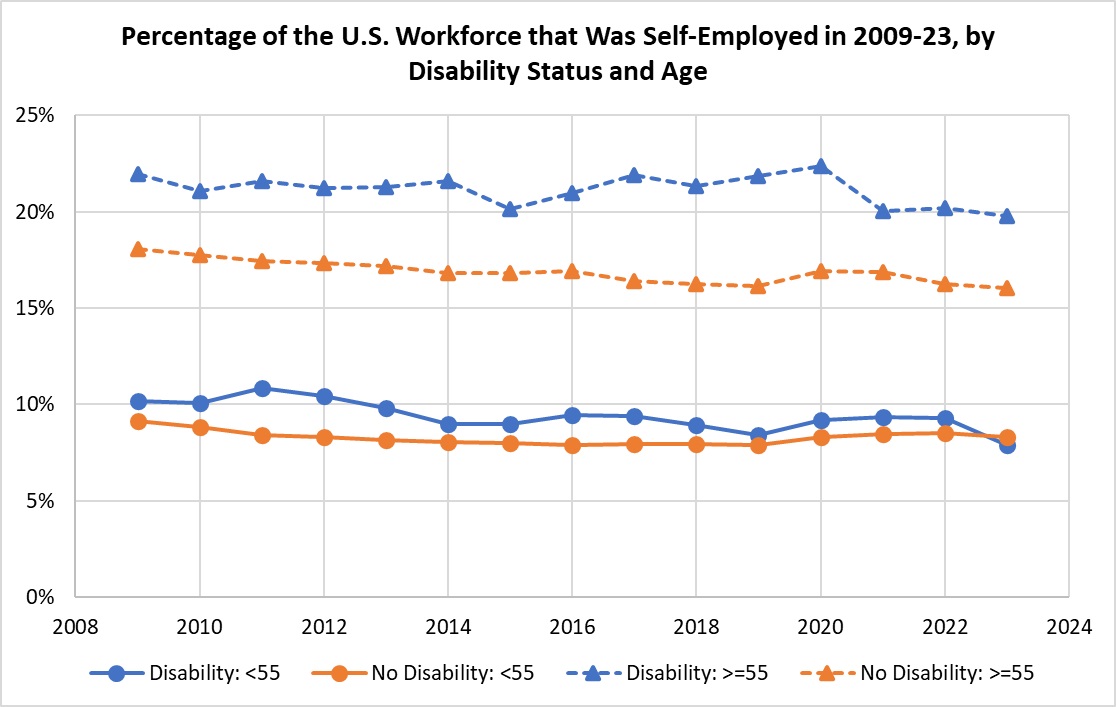
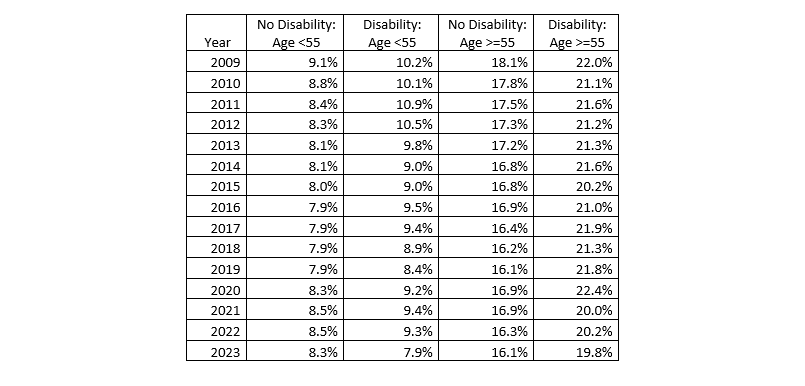
• Overall, older workers (age 55 or older) are much more likely than younger workers (under 55) to be self-employed. In addition, older workers with disabilities are more likely to be self-employed compared to those without disabilities.
• The differences in self-employment rates between disabled and nondisabled workers 55 or older has persisted across time.
• From 2009 to 2022, the percentage of workers under age 55 who were self-employed with a disability was marginally higher than the percentage of nondisabled self-employed people. In 2023, the percentage of self-employed disabled workers saw a small dip to about 8.0%, matching the percentage of self-employed nondisabled workers under 55.
• By contrast, among older workers, the percentage of disabled, self-employed people was consistently—and statistically significantly—higher than that of self-employed nondisabled people between 2009 and 2023.
_____________________________________
We encourage small businesses that wish to promote inclusion and the employment of disabled people to check out the ODEP-funded Employer Assistance and Resource Network on Disability Inclusion’s (EARN) new Small Business Toolkit, which provides:
• Practical, affordable strategies to hire and retain disabled workers
• Information to improve disability inclusion with limited resources
• Advice on common topics for workers with disabilities
• Opportunities to learn about tax incentives and other supports for small businesses
David Rosenblum is a senior economist with the Office of Disability Employment Policy.
Christopher McLaren is director of research and evaluation in the Office of Disability Employment Policy.

 U.S. Department of Labor Blog